|
For many years, Phillip CFD had asked our clients the following question.

The consistent feedback we got was that many had wished for a better charting tool. Our team decided to go back to the drawing board to rethink the way we did our charts.
Well, we are happy to show you what we have done thus far.
Here are some of the key new features of our CFDTrader 2 Charting already LIVE in this BETA version:
- Index Charting
Charts for ALL Index CFD counters such as FTSE Straits Times Index CFD, Wall Street Index CFD, Hong Kong 40 Index CFD and Japan 225 Index CFD are now available. Prices are based on mid-price.
- Live Charts For All Equity CFD Markets
Live charts are available for ALL stocks listed on the CFD platform with a wide selection of chart intervals ranging from 1 minute to 1 year. For US and Hong Kong live charts, you must subscribe for live prices via POEMS otherwise you will only be able to view delayed price charts.
- Multiple Charting Screens
Load up a workspace with multiple charts to analyse the perfomance of different counters within the same time frame or similar counters with different time frames as shown in the charts below.
-
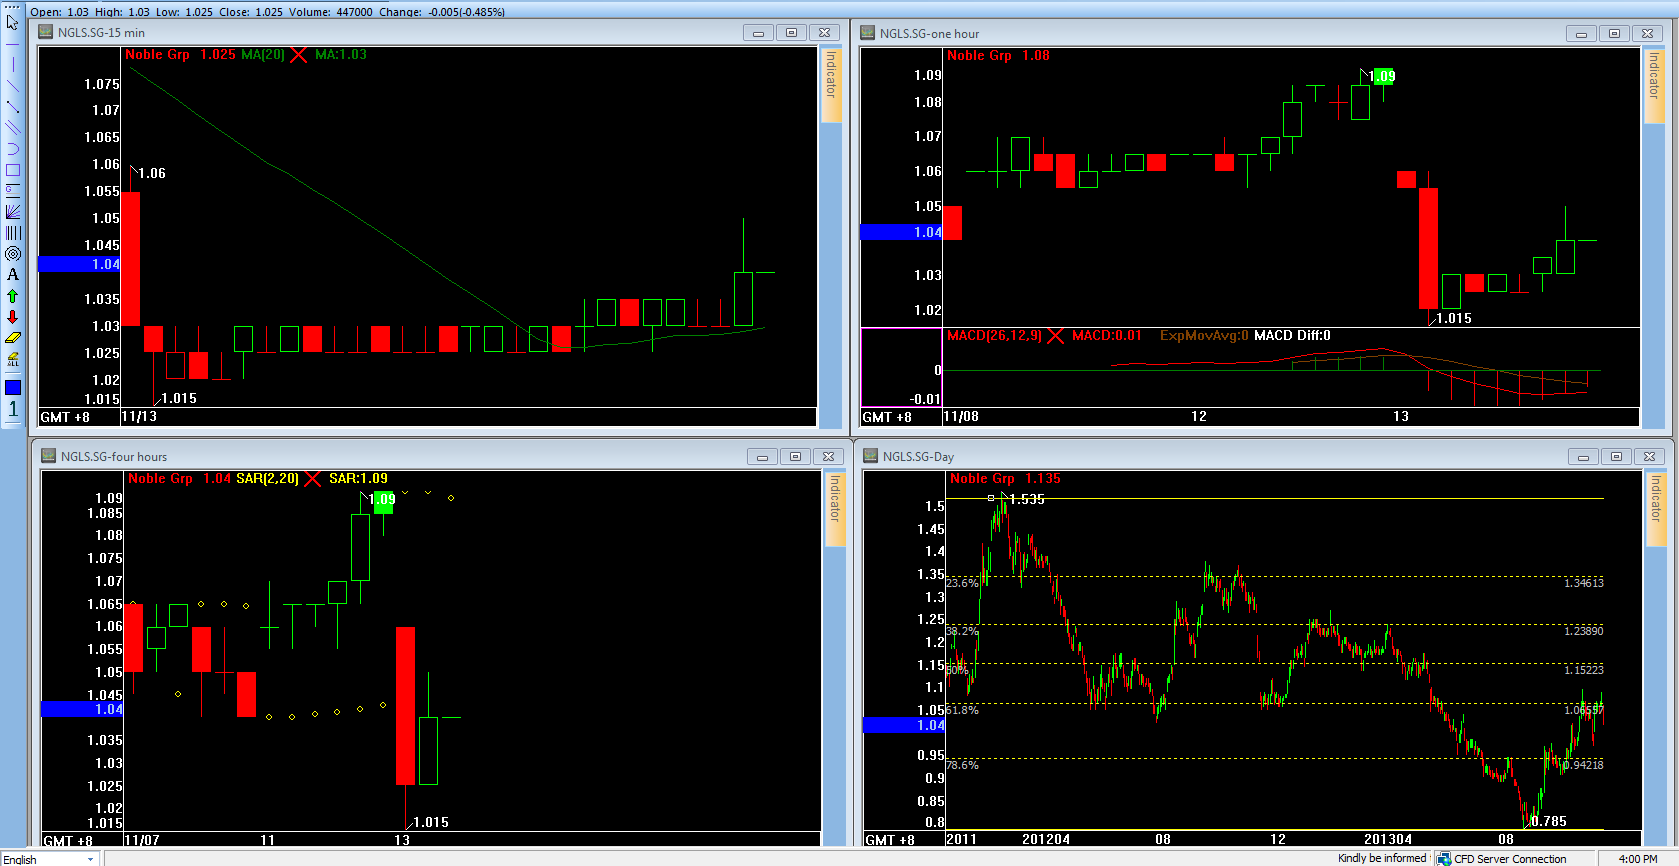 +Click Image To Enlarge +Click Image To Enlarge
- Up to 14 years of Historical Data
You can track the historical price action for counters up to 14 years. The table below shows the period for each market.
| Market |
Period |
| Singapore (SGX) |
14 years |
| Malaysia (KLSE) |
10 years |
| Hong Kong (HKSE) |
14 years |
| United States (NYSE/NASDAQ/AMEX) |
14 years |
| Index |
8 months |
- Large Selection of Indicators
Simply click on the indicator tool bar on the right of the chart to load up a list of indicators, select the ones you like and it will show up on the chart. It includes popular indicators such as configurable Moving Averages, MACD, RSI and Bollinger Bands. More advanced indicators such as Accumulation Distribution Line (ADI), On-Balance Volume (OBV) and Stochastic Oscillator (OSC) are also available.
- Customisable Charting Space
Create your own charting templates, save and load it up anytime you wish. Indicators will be added in by default to the next chart you open. You can also save and print charts for your trading journal.
- Trade Directly From Charts
In the Setting > OrderType menu, you have the option to choose trading from charts. You will be able to choose to place orders based on market prices or on prices indicated on the chart.
- Candlestick Recognition
With the click of a button, you will be able to view candlestick patterns identified by our system. Never miss an opportunity again!
- Supports Simplified Chinese Language(支持简体中文)
To better support our Chinese clients, the platform language can also be changed from English to Chinese and vice versa.
To use the new charting tool, download and install the latest version of CFDTrader2. If you are an existing CFDTrader2 user, simply update your version to the latest.

As you are among the first few to experience it, we appreciate any feedback. Even if it is a new indicator which is missing from our comprehensive list or a feedback on how we should enhance our user interface, we'd love to hear from you. Do drop us a line at cfd@phillip.com.sg or call us at +65 6336 4564.
Thank You and Happy Trading!
Best Regards,
Lee Chang Wen
Head of CFD Department
Phillip Securities Pte Ltd
|