Investing in Tech Giants: Strategic Insights into Palantir, TSMC, and Microsoft


Yeo Sze Han, Assistant Manager, Dealing | Contract for Differences
Yeo Sze Han graduated from the National University of Singapore with a BSc (Hons) degree in Science. He has passed the Chartered Financial Analyst (CFA) level 1 examination and likes reading up on stock market news and updates.
Sze Han likes to incorporate fundamental and technical analysis when advising clients on stocks, ETFs and CFDs.
Mavis Ang, Dealer | Contract for Differences
Mavis Ang graduated from the Tunku Abdul Rahman University College with a Bachelor’s degree in Finance and Investment with Honours (Specialisations in Accountancy and Finance).
She is passionate about investing and data analysis, she is enjoying on doing data analysis by using various platform. She is also interested on Technical analysis on trading.
In the ever-evolving landscape of technology and data analytics, certain companies stand out for their innovative contributions and market impact. This article delves into three prominent players in the tech industry: Palantir Technologies (PLTR), Taiwan Semiconductor Manufacturing Company (TSMC), and Microsoft (MSFT). Whether you’re an investor, tech enthusiast, or industry professional, this overview offers valuable insights into the strategies and innovations driving the success of these 3 companies.

Palantir (ticker: PLTR)
Palantir Technology is a data analytics software company co-founded in 2003 by Alex Karp, Peter Thiel, Stephen Cohen, Joe Lonsdale and Nathan Gettings. The company’s name is derived from the word “palantiri” from The Lord of the Rings, and it refers to indestructible crystals that served as “seeing-stones” that allowed users to see into events in other parts of the world in the story.
The company’s main revenue-generating products are its two data analytics platforms – Palantir Gotham and Palantir Foundry.
Gotham is Palantir’s defense and intelligence platform, and it is used by government agencies, intelligence organisations, and defence entities. Gotham provides powerful data integration, analytics, and visualisation tools for users to analyse large and complex datasets to uncover patterns, detect anomalies, and make informed decisions. Among Its government clientsinclude the US Army, US Navy, National Security Agency (NSA), Central Intelligence Agency (CIA), Department of Homeland Security, and the Center for Disease Control (CDC).
In 2021, Palantir followed up on the success of Gotham with the launch of their second platform, Palantir Foundry. Foundry is designed for clients in the commercial sectors, and the platform enables these enterprises to integrate, manage, and analyse data from multiple sources, allowing these businesses to gain insights, optimise processes, and improve decision-making. Foundry’s commercial clients span across diverse industries, including consumer, energy, financial services, healthcare, industrials, telecommunications, and transportation sectors. Amazon, IBM, Morgan Stanley, Ferrari, Airbus and Merck KGaA are some of the big-brands using Palantir Foundry.
Due to the versatility of Palantir’s platforms, essentially all large scale organisations that handle big volumes of data can leverage on Palantir’s powerful suite of data-analytic software offerings to help in analysis of complex information and decision making.

Fundamental Analysis
Palantir has been showing strong revenue and income growth over the last 5 years and the originally loss-making company turned profitable last year in FY2023.
Recently on 6 May 2024, the company had announced its latest quarterly results (FY2024 Q1) and figures released showed that the company is still registering stellar growth, with revenue growing 21% year-over-year.
Gotham continued to be the main revenue driver for Palantir, contributing to around 60% of total revenue, but Foundry is a faster-growing segment and will likely become the bigger revenue contributor for the company within the next 1-2 quarters.
Notably, the company’s total customer count grew 42% year-over-year in the latest financial report. Much of this fast growth can be attributed to Palantir’s innovative deployment of AI technology into its platforms, as well as their introduction of AI platform boot camps where potential customers can participate in hands-on sessions to quickly adopt and use Palantir’s software to solve real business problems immediately or within days.

Technical Analysis

Palantir started trading on NYSE under the ticker symbol “PLTR” on 30 Sept 2020 via a direct listing.
Examining Palantir’s price chart from 2020 til current, we can see that the stock movement can be very volatile, with steep rises and drops across the years. In Jan 2021 for example, the stock was trading at a high of US$44 but this cratered to US$6 in Dec 2022 (a drop of -86% from the high), and then rebounded steeply to its recent high of US$27 in Mar 2024 (a rise of +366% from the low).
At the time of writing (May 2024), Palantir is trading at US$21.76, with a P/E multiple of 171x. This high P/E valuation suggests that investors are expecting Palantir to show continued strong growth for the foreseeable future. Any failure by Palantir to meet market’s expected growth rates will see the stock price tumble, while continued growth of Palantir’s business will also propel its stock price higher.
With its history for huge rises and falls, this stock is not for the risk-averse or weak-handed, but investing in Palantir can be rewarding for the opportunistic investor if the company continues to grow at its current pace and if there are no major broad market calamities.
Price resistance for Palantir is at around US$27 and near-term price supports are at US$21 and US$14.

Taiwan Semiconductor Manufacturing Company TSMC (ticker: TSM)
Taiwan Semiconductor Manufacturing Company Limited (TSMC) was established in 1987 and the company is notable for being the world’s first semiconductor foundry dedicated to manufacturing integrated circuits (ICs) for other companies based on their designs.
TSMC manufactures semiconductor chips for a wide range of applications, including for High-Performance Computing, Smartphones, Internet of Things (IoT) devices, Automotive Electronics, and Digital Consumer Electronics. In 2023, they served 528 customers and manufactured parts for more than 11,895 products. Apple and Nvidia are some of the famous brands that are engaging TSMC for their chip-manufacturing processes.
TSMC consistently pushes the frontiers of semiconductor innovation, and the company has proprietary knowledge and expertise in producing the world’s most advanced chips today. Notably, their 3nm process is currently the world’s most developed semiconductor technology, and they began high volume production of chips with 3nm nodes in 2022. The company is currently refining their 2nm process and has pencilled in plans to start mass production of chips with 2nm nodes in second half of 2025.

Due to its technological edge over competitors, TSMC forms an integral backbone of the world’s supply chain for advanced semiconductor chips and is well-positioned to benefit from the current AI boom.
TSMC’s manufacturing facilities are primarily located in Taiwan, with additional operations in China, Japan and the US. The company is constructing new fabs in Arizona, USA, and Kumamoto, Japan, and has plans to invest in a new specialty technology fab in Dresden, Germany.
The construction of new plants in Arizona is significant as it aligns with the US government’s strategy to onshore semiconductor manufacturing and to strengthen and safeguard US national and security interests amidst a backdrop of economic and technological competition with China.
TSMC had its American Depository Receipt (ADR) listed on the NYSE under the ticker symbol “TSM” on 08 Oct 1997.
Fundamental Analysis
Although TSMC commands significant dominance of the semiconductor industry (TSMC accounted for 28% of the world’s semiconductor output in 2023), its business can nonetheless still be affected by seasonality fluctuations. Notably, the company’s Smartphone and PC segments, for example, have been experiencing a downturn since 2022, and demand for automotive-related chips have also started to slow down.
However, the company’s CEO, C.C. Wei, remains optimistic, expecting overall revenue to grow by at least 20% this year on the back of a broad market recovery, as well as a tech renaissance brought about by the surge in AI applications.

Currently, 65% of the company’s revenue is contributed by advanced technology of 7nm and below and this proportion is expected to increase over the next few years as the company ramps up production of advanced nodes.
Technical Analysis
Since its Oct 2022 low of US$60, the stock had been on a steady uptrend, increasing by more than 250%.
The stock price experienced a fresh surge recently following the company’s announcement of a 60% year-on-year jump in sales figures for April. Additionally, Nvidia’s strong earnings report in May further fueled TSMC’s recent rally.
At its current price of US$162, the stock is trading at a higher-than-historical-average P/E of 31x, but this is in-line with higher P/E multiples observed among comparable semiconductor peers due to elevated interest and orders fueled by the AI revolution.
Company Name Ticker P/E Ratio
TSMC ADR TSM.US 31.33x
Intel INTC.US 31.73x
SMIC 688981.CH / 0981.HK 73.39x / 25.77x
Micron MU.US NA (loss-making)
Samsung Electronics 005930.KR NA (loss-making)
SK Hynix 00660.KR NA (loss-making)
iShares Semiconductor ETF SOXX.US 34.81x
VanEck Semiconductor ETF SMH.US 39.23x

)")
Microsoft (ticker: MSFT)
Founded on 4 April, 1975, by Bill Gates and Paul Allen, Microsoft is now recognised as the world’s biggest supplier of computer software. The company operates in over 60 countries, with its corporate headquarters situated in Redmond, Washington.
At the dawn of the personal computer era, in 1975, Bill Gates and Paul Allen founded Microsoft with the goal of developing operating system software for PCs. The Windows operating system from the corporation eventually took over the PC market. Over the years, Microsoft branched out into PC hardware and accessories, video games, internet services, productivity software, server software, and video games.
Under the leadership of Satya Nadella, who became CEO in 2014, Microsoft made a significant push into cloud computing. The company’s current cloud offerings include Office 365 productivity tools, Dynamics enterprise software, and Azure infrastructure services. Microsoft also owns significant platforms like GitHub, Skype, and LinkedIn.

In more recent times, Microsoft has been promoting the company’s advances in artificial intelligence, notably integrating its generative AI technologies into its software and services.
In 2024, OpenAI, which has attracted substantial investment from Microsoft, enhanced its valuation significantly. The company signed a deal with venture capital firm Thrive Capital, elevating its worth to at least US$80 billion—a nearly threefold rise from just nine months prior. According to the Times, which cited anonymous sources with knowledge of the agreement, OpenAI will participate in an ongoing share sale under the “so-called tender offer” headed by Thrive. The deal would enable staff members to cash out their shares in the artificial intelligence startup. Based on CB Insights data published by the Times, the business’s US$80 billion valuation would place it third globally among internet startups, behind Elon Musk’s SpaceX (US$150 billion) and TikTok parent company ByteDance (US$225 billion).
Additionally, OpenAI has developed notable innovations such as Dall-E, an image generator, and ChatGPT, a chatbot. Microsoft initially invested approximately US$1 billion in OpenAI in 2019 and announced a further investment believed to be around US$10 billion in 2023. Furthermore, Microsoft has showcased its new Bing search engine and Edge web browser, both enhanced with AI technology, leading to a 4.2% jump in MSFT stock following the announcement.
Microsoft initially invested approximately $1 billion in OpenAI in 2019 and announced a further investment believed to be around $10 billion in 2023. Furthermore, Microsoft has showcased its new Bing search engine and Edge web browser, both enhanced with AI technology, leading to a 4.2% jump in MSFT stock following the announcement.

Fundamental Analysis

In 2023, Microsoft generated approximately US$212 billion in revenue, with server and cloud services accounting for nearly US$80 billion, and office goods and cloud services accounting for nearly US$49 billion, respectively. us$21.5 billion was made by Windows, over US$15.4 billion by gaming, LinkedIn over US$15 billion, and search advertising (via bing) over $12 billion. Devices (PC) contributed US$5.5 billion, while enterprise (GitHub) generated US$7.7 billion. In fact, Microsoft has changed over time to shift the majority of its revenue to servers and the cloud making its Azure cloud business one of the company’s most significant divisions. Besides, its extensive B2B distribution network and effective acquisition strategy have allowed it to maintain its position as the industry leader.
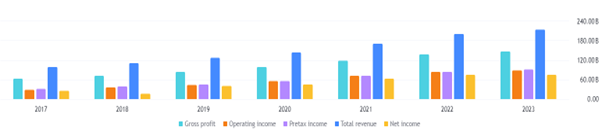
Based on the chart above, it’s clear that Microsoft has been growing consistently over the years. The year-over-year revenue increase is a strong indicator of the company’s robust business performance and sustainability. This continuous growth not only highlights Microsoft’s effective market strategies but also its ability to innovate and stay relevant in the competitive tech landscape.
Such a positive trend signifies that Microsoft is a well-managed and reliable company, well-positioned for long-term success and stability. This ongoing growth is a testament to its strong market presence and potential for future expansion.

According to the company’s latest earnings announcement, we can observe a consistent trend where reported earnings have not only met but exceeded the estimated earnings. This pattern of surpassing expectations has been evident for several consecutive quarters, showcasing a steady increment in earnings each time. Such performance highlights the company’s strong operational efficiency and its ability to deliver on its promises.
This consistent upward trajectory in earnings suggests that the company has robust business strategies in place and is adept at navigating market challenges to achieve its financial goals. The ability to consistently outperform projections is a strong indicator of the company’s stability and reliability, reinforcing confidence among investors and stakeholders.
Technical Analysis

Based on the technical charting above, it is evident that Microsoft is currently on an uptrend from 2023 to 2024. This sustained upward movement reflects strong market confidence in the company’s performance and growth prospects. However, it’s important to note that the Relative Strength Index (RSI) is quite high at the moment. A high RSI often indicates that a stock is overbought and may be due for a price correction. Given this, we might anticipate a potential drop in Microsoft’s stock price in the short term, followed by a bounce back.
In summary, while the high RSI suggests caution in the short term, Microsoft’s overall uptrend and solid business fundamentals make it a compelling choice for long-term investors looking to buy on dips and hold for sustained growth.
Promotion

As we have explored, Palantir Technologies, Taiwan Semiconductor Manufacturing Company (TSMC), and Microsoft stand as leading players in the tech industry, each driving forward with unique strategies and ground-breaking innovations. These companies not only shape the future of technology but also present significant opportunities for investors looking to capitalise on their growth and market influence.
To encourage you to take advantage of these opportunities, we’re excited to offer a special promotion. Open a CFD account and start trading with us between now and 31 August, to receive free CFD shares worth up to US$400 (Palantir, TSMC, or Microsoft)! This is a limited-time offer designed to help you kickstart your investment journey with some of the most promising tech companies in the market. Click here to learn more!
References
[1] https://investor.tsmc.com/english
[2] https://finance.yahoo.com/news/tsmc-keeps-sales-growth-april-053418822.html
[3] https://focustaiwan.tw/business/202405230014
[5] https://finance.yahoo.com/news/taiwan-arizona-ties-history-behind-093000132.html
[6] https://investors.palantir.com/
[7] https://en.wikipedia.org/wiki/Palantir_Technologies
[8] https://www.palantir.com/platforms/aip/bootcamp/
[9] https://www.investors.com/research/microsoft-stock-buy-now/
[10] https://www.investors.com/news/technology/microsoft-stock-flirts-with-breakout-on-ai-software-news/
[11] https://1000logos.net/palantir-logo/
[12] https://www.palantir.com/platforms/gotham/europa/
[14] – https://www.tsmc.com/english/dedicatedFoundry/manufacturing/engineering
More Articles
Playing Defence: Diversification in Forex Trading

Learn how strategic planning and risk management can help you navigate the highs and lows of the forex market. Don’t miss out on unlocking the secrets to long-term profitability!
From Boom to Bust: Lessons from the Barings Bank Collapse

Did you know that the collapse of Barings Bank in 1995 was from massive losses incurred by a rogue trader? Delve into the tale of how Nick Leeson’s fraudulent investments sent shockwaves through the financial world.
Japan's Economic Resurgence – Unveiling the Tailwinds Behind Nikkei 225’s Record Leap

Discover the driving forces behind Japan’s market surge, delve into its economic performance and learn how CFD products can help you navigate the Japanese market’s volatility via our article!
Disclaimer
These commentaries are intended for general circulation and do not have regard to the specific investment objectives, financial situation and particular needs of any person. Accordingly, no warranty whatsoever is given and no liability whatsoever is accepted for any loss arising whether directly or indirectly as a result of any person acting based on this information. You should seek advice from a financial adviser regarding the suitability of any investment product(s) mentioned herein, taking into account your specific investment objectives, financial situation or particular needs, before making a commitment to invest in such products.
Opinions expressed in these commentaries are subject to change without notice. Investments are subject to investment risks including the possible loss of the principal amount invested. The value of units in any fund and the income from them may fall as well as rise. Past performance figures as well as any projection or forecast used in these commentaries are not necessarily indicative of future or likely performance.
Phillip Securities Pte Ltd (PSPL), its directors, connected persons or employees may from time to time have an interest in the financial instruments mentioned in these commentaries.
The information contained in these commentaries has been obtained from public sources which PSPL has no reason to believe are unreliable and any analysis, forecasts, projections, expectations and opinions (collectively the “Research”) contained in these commentaries are based on such information and are expressions of belief only. PSPL has not verified this information and no representation or warranty, express or implied, is made that such information or Research is accurate, complete or verified or should be relied upon as such. Any such information or Research contained in these commentaries are subject to change, and PSPL shall not have any responsibility to maintain the information or Research made available or to supply any corrections, updates or releases in connection therewith. In no event will PSPL be liable for any special, indirect, incidental or consequential damages which may be incurred from the use of the information or Research made available, even if it has been advised of the possibility of such damages. The companies and their employees mentioned in these commentaries cannot be held liable for any errors, inaccuracies and/or omissions howsoever caused. Any opinion or advice herein is made on a general basis and is subject to change without notice. The information provided in these commentaries may contain optimistic statements regarding future events or future financial performance of countries, markets or companies. You must make your own financial assessment of the relevance, accuracy and adequacy of the information provided in these commentaries.
Views and any strategies described in these commentaries may not be suitable for all investors. Opinions expressed herein may differ from the opinions expressed by other units of PSPL or its connected persons and associates. Any reference to or discussion of investment products or commodities in these commentaries is purely for illustrative purposes only and must not be construed as a recommendation, an offer or solicitation for the subscription, purchase or sale of the investment products or commodities mentioned.
This advertisement has not been reviewed by the Monetary Authority of Singapore.
CFD Promotion Disclaimer
This promotion is provided to you for general information only and does not constitute a recommendation, an offer or solicitation to buy or sell the investment product mentioned. It does not have any regard to your specific investment objectives, financial situation or any of your particular needs. Accordingly, no warranty whatsoever is given and no liability whatsoever is accepted for any loss arising whether directly or indirectly as a result of your acting based on this information.
Investments are subject to investment risks. The risk of loss in leveraged trading can be substantial. You may sustain losses in excess of your initial funds and may be called upon to deposit additional margin funds at short notice. If the required funds are not provided within the prescribed time, your positions may be liquidated. The resulting deficits in your account are subject to penalty charges. The value of investments denominated in foreign currencies may diminish or increase due to changes in the rates of exchange. You should also be aware of the commissions and finance costs involved in trading leveraged products. This product may not be suitable for clients whose investment objective is preservation of capital and/or whose risk tolerance is low. Clients are advised to understand the nature and risks involved in margin trading.
You may wish to obtain advice from a qualified financial adviser, pursuant to a separate engagement, before making a commitment to purchase any of the investment products mentioned herein. In the event that you choose not to obtain advice from a qualified financial adviser, you should assess and consider whether the investment product is suitable for you before proceeding to invest and we do not offer any advice in this regard unless mandated to do so by way of a separate engagement. You are advised to read the trading account Terms & Conditions and Risk Disclosure Statement (available online at https://www.poems.com.sg/) before trading in this product.
