HTI: Breakout Trading Opportunity
Published On: 11 March 2024, 9:20 AM | Kwong Jun Yuan, Dealer
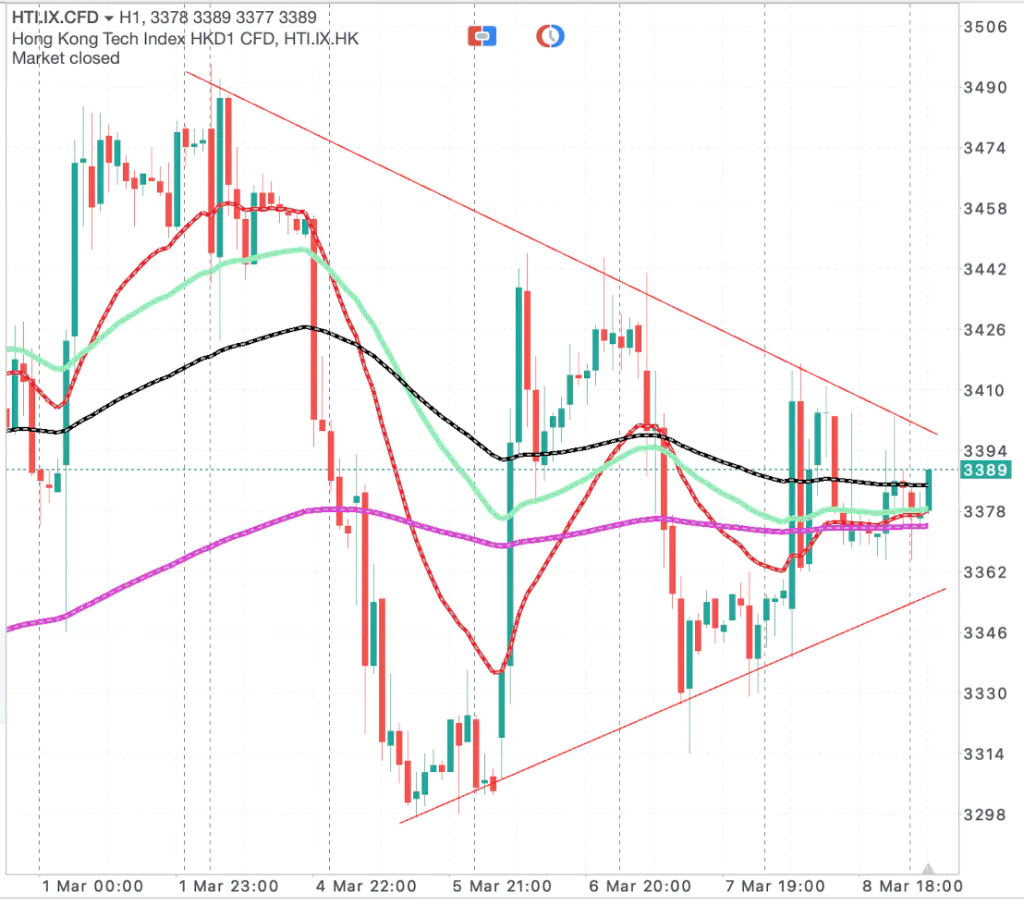
Key Entry Price Pivot(s)
- 3420
- Long at level 3420, take profit at 3540, stop loss at 3338
- Short at level 3335, take profit at 3200, stop loss at 3418
- Analysis of HTI 1-hour chart reveals a symmetrical triangle pattern since March 4, 2024, indicating a period of consolidation.
- The narrowing gap between the converging trend lines suggests an imminent breakout, typically resulting in a significant price movement.
- A trading strategy could involve taking long or short positions based on the breakout direction once the resistance level is breached with a strong candlestick bar.