SIA (C6L): Trading Opportunity
Published On: 10 July 2023, 9.30 AM | Alex Lee, Senior Dealer
Trade Setup
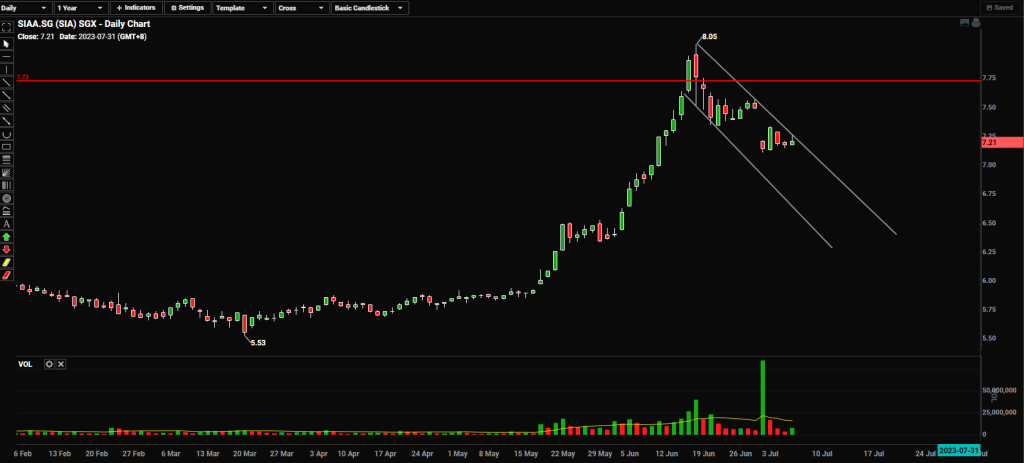
- Looking at the daily chart of SIA, we can see that price has hit the resistance line (red line) of $7.73 and failed to close above it, rejecting the resistance line.
- Currently, price has formed a downward trend channel.
- We can look for shorts upon rejection of the resistance of the downward channel based on a shorter timeframe in confluence with the daily timeframe bias. We may see price extending towards the support of the trend channel.
- However, a break above the resistance of the downwards channel may signal an overall shift to the upside and we may look for longs upon retracement.