S&P Index Chart Analysis
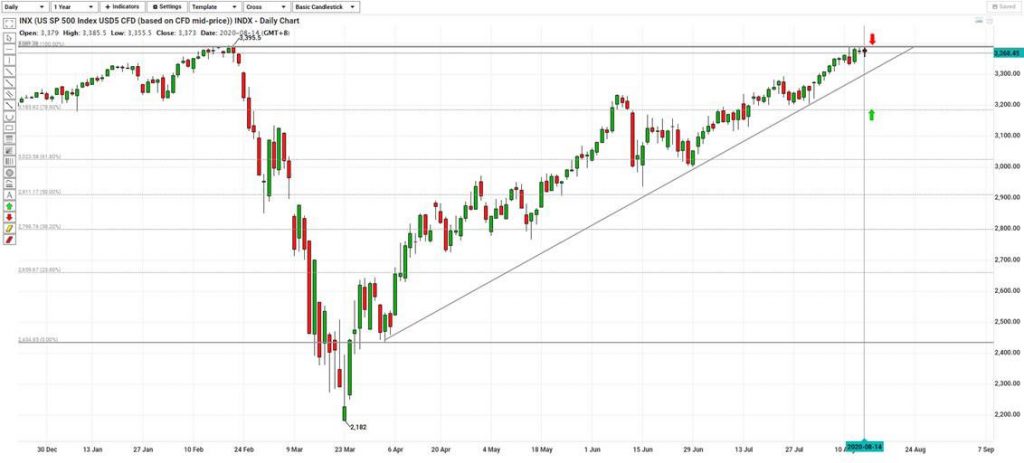
- Taking a look at the US SP 500 Chart, we can see that price has been on a strong bullish momentum for the past couple of weeks and is currently close to the all-time high of 3395.5 on 20/2 this year.
- The small inside bar at the end of Friday last week shows the lack of momentum, together with the strong resistance level of the all time high, could signal a possible pullback. The chart also shows an ascending triangle formation where price is currently close to the end of the formation. We can expect a breakout in either direction this week or the coming week. If price were to break the bottom trendline, we can expect price to test the 61.8% Fibonacci retracement level (green arrow).
- If price instead, managed to close above the ATH (red arrow), we will expect a strong bullish breakout, with the ATH then acting as a strong support level.
Disclaimer
This material is provided to you for general information only and does not constitute a recommendation, an offer or solicitation to buy or sell the investment product mentioned. It does not have any regard to your specific investment objectives, financial situation or any of your particular needs. Accordingly, no warranty whatsoever is given and not liability whatsoever is accepted for any loss arising whether directly or indirectly as a result of your acting based on this information.
Investments are subject to investment risks. The risk of loss in leveraged trading can be substantial. You may sustain losses in excess of your initial funds and may be called upon to deposit additional margin funds at short notice. If the required funds are not provided within the prescribed time, your positions may be liquidated. The resulting deficits in your account are subject to penalty charges. The value of investments denominated in foreign currencies may diminish or increase due to changes in the rates of exchange. You should also be aware of the commissions and finance costs involved in trading leveraged products. This product may not be suitable for clients whose investment objective is preservation of capital and/or whose risk tolerance is low. Clients are advised to understand the nature and risks involved in margin trading.
You may wish to obtain advice from a qualified financial adviser, pursuant to a separate engagement, before making a commitment to purchase any of the investment products mentioned herein. In the event that you choose not to obtain advice from a qualifies financial adviser, you should assess and consider whether the investment product is suitable for you before proceeding to invest and we do not offer any advice in this regard unless mandated to do so by way of a separate engagement. You are advised to read the trading account Terms & Conditions and Risk Disclosure Statement (available online at www.poems.com.sg) before trading in this product.
Any CFD offered is not approved or endorsed by the issuer or originator of the underlying securities and the issuer or originator is not privy to the CFD contract. This advertisement has not been reviewed by the Monetary Authority of Singapore.
