Technical Analysis: DXY & Gold update – Fed’s potential rate cut and Q.E expectation send dollar lower
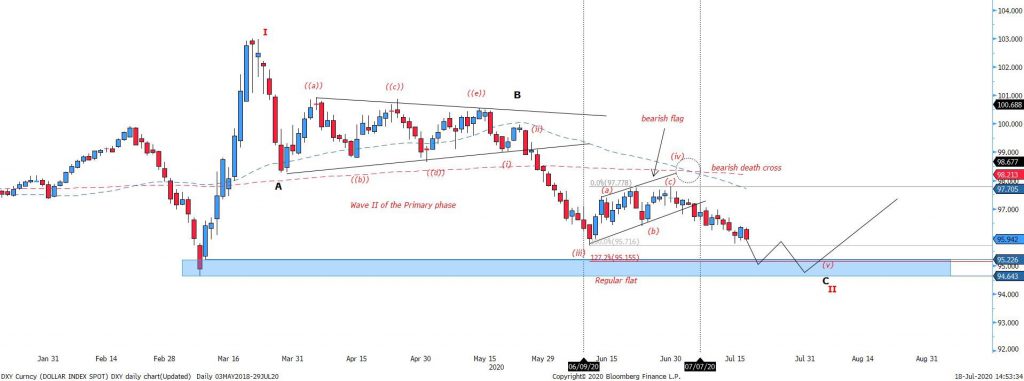
Figure 1: Dollar Index – Elliott sub-wave correction in place, with price falling towards support zone
- The U.S market dollar index (DXY) fell for the fourth straight weeks as the COVID-19 is still the key subject to market’s weakness.
- The ongoing EU recovery fund meeting remains in deadlock and this may cause uncertainty in the Euro, which is heavily weighted in the dollar index.
- Another reason is that the US dollar may face weakness is because the traders are factoring in further rate cuts and increase QE to support the economy
The dollar index has broken out of the bearish flag mentioned in our report on 6th July. Prices look promising after a daily morning star appeared but last Friday’s bearish candle shattered the hope of any rally and the index is set to break the immediate support at 95.71.
Judging from the wave analysis, the final sub-wave 5 is ongoing with the critical support zone deciding the fate of the Dollar. Should the crucial support zone between 94.64-95.22 is broken, then the Dollar will form an extended sub-wave (v) with the next potential support level at 92.00.
 Figure 2: Gold Monthly chart – ABC corrective wave is still in play. Be cautious of the recent rise
Gold’s bullish has come a long way in line our expectation on 16th December 2019 last year. Firstly, Gold has defied all odds and broke the US$1,600 resistance level and has successfully traded above US$1,800. Should Gold continue to rally and it will due to the dollar weakness for now, the likelihood of a reversal at $1,900 is very possible.
In the longer-term period, there are two factors weighing on the direction of Gold prices. If the 1,900 level is broken, then the larger corrective ABC wave will be invalidated. The next price level Gold will target is at the 127.2% extension level of A which stands at US$2,127.58. Otherwise, if Gold fails to sustain above US$1,900, a downward wave C will commence. All in all, Gold’s monthly outlook is corrective even with the recent hype on Gold’s bullish outlook.
 Figure 3: Gold daily chart – Potential upside in play
The daily chart of Gold shows a clear picture with upside momentum slowing as shown by the multiple candles with long shadows since Gold broke out of the range between April and July. Looking at Fibonacci extension of the price range, the recent bullish flag indicates that Gold will continue to edge higher, minimally to the 161.8% extension level. Should that level be invalidated, the next target will be at 200.00% extension level.
Disclaimer
This material is provided to you for general information only and does not constitute a recommendation, an offer or solicitation to buy or sell the investment product mentioned. It does not have any regard to your specific investment objectives, financial situation or any of your particular needs. Accordingly, no warranty whatsoever is given and not liability whatsoever is accepted for any loss arising whether directly or indirectly as a result of your acting based on this information.
Investments are subject to investment risks. The risk of loss in leveraged trading can be substantial. You may sustain losses in excess of your initial funds and may be called upon to deposit additional margin funds at short notice. If the required funds are not provided within the prescribed time, your positions may be liquidated. The resulting deficits in your account are subject to penalty charges. The value of investments denominated in foreign currencies may diminish or increase due to changes in the rates of exchange. You should also be aware of the commissions and finance costs involved in trading leveraged products. This product may not be suitable for clients whose investment objective is preservation of capital and/or whose risk tolerance is low. Clients are advised to understand the nature and risks involved in margin trading.
You may wish to obtain advice from a qualified financial adviser, pursuant to a separate engagement, before making a commitment to purchase any of the investment products mentioned herein. In the event that you choose not to obtain advice from a qualifies financial adviser, you should assess and consider whether the investment product is suitable for you before proceeding to invest and we do not offer any advice in this regard unless mandated to do so by way of a separate engagement. You are advised to read the trading account Terms & Conditions and Risk Disclosure Statement (available online at www.poems.com.sg) before trading in this product.
Any CFD offered is not approved or endorsed by the issuer or originator of the underlying securities and the issuer or originator is not privy to the CFD contract. This advertisement has not been reviewed by the Monetary Authority of Singapore.
