


“History doesn’t repeat itself, but it does rhyme”
Mark Twain
Did you know that US small cap stocks are often perceived as a reliable economic barometer of US economic activity [1]? In the aftermath of an economic recession, small-cap stocks typically outperform large-cap stocks [2]. This may be due to several factors, such as investors’ renewed appetite for risk or small caps’ greater sensitivity to economic developments.
In this article, we utilise historical data from the Russell 1000 & 2000 Indices to investigate this phenomenon. We then examine the returns of the Russell 1000 & 2000 during Black Thursday 2020 and their potential future outcomes.
The Russell 3000 Index represents around 98% of publicly-traded US equities. The Russell 1000 Index consists of the largest 1,000 companies in the US and accounts for more than 90% of the total market capitalisation in the Russell 3000 Index. The Russell 2000 Index represents about 2,000 of the smallest-capitalisation stocks in the Russell 3000 Index and 8% of Russell 3000’s market capitalisation.
Historical Data (2008 Global Financial Crisis)
Are US small caps really a reliable economic barometer?
To investigate this, we used US Real QoQ GDP growth data and the returns of the Russell 1000 & 2000 indices from the 2008 Global Financial Crisis to end-2010.
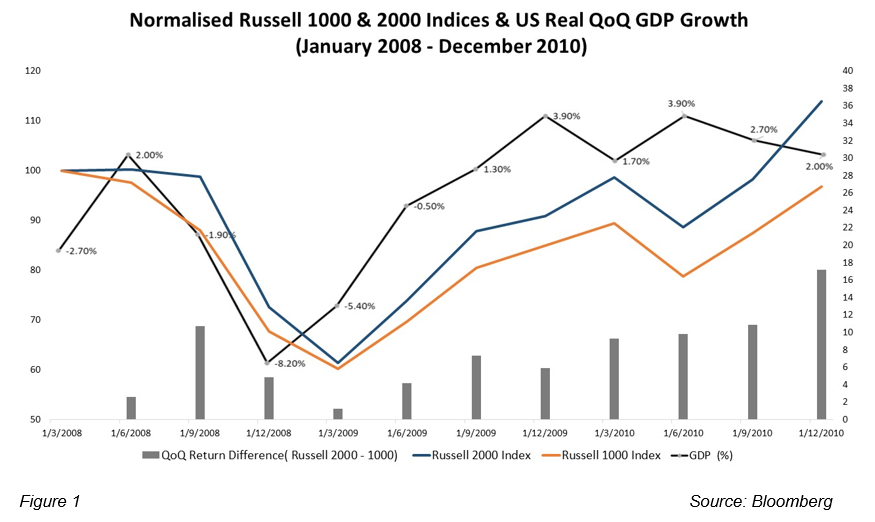
As shown in Figure 1, the performance of the Russell 2000 Index indeed led the Russell 1000 Index after the US GDP improved during 1Q 2009 and beyond. The performance lead of the Russell 2000 Index over the Russell 1000 Index from 1Q 2009 onwards could be attributed to several factors, including small-cap companies’ greater sensitivity to economic developments and investors’ renewed appetite for risk in a post-recessionary environment. The largest difference in the QoQ returns of the Russell 1000 & 2000 Indices could be seen in 3Q 2008 and 4Q 2010. This is consistent with the theory of small-cap stocks’ greater sensitivity to economic cycles and developments.
Russell 1000 & 2000 Performances (Post-Black Thursday 2020)
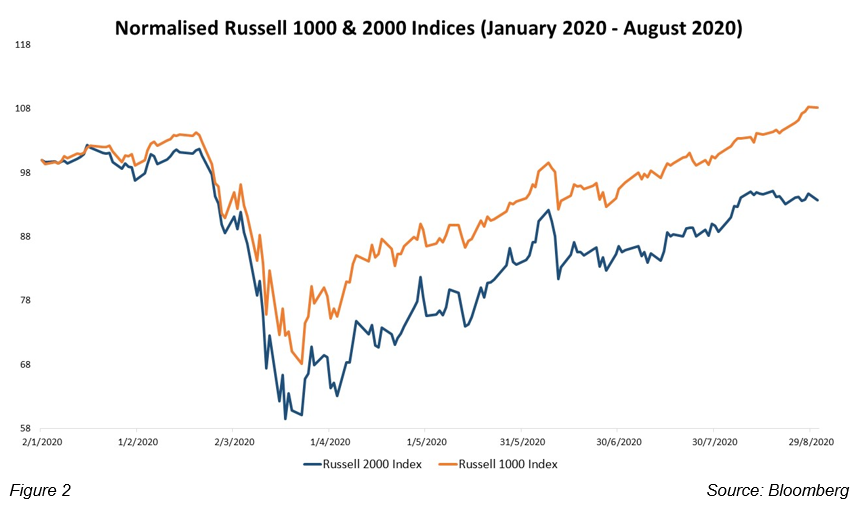
So, how did the returns of the Russell 1000 & 2000 Indices fare after Black Thursday 2020? Going back to the period from January 2020 to end-Aug 2020, we see from Figure 2 that both the Russell 1000 & 2000 Indices have recovered from their bottoms in March 2020. However, strangely enough, the returns of the larger-cap Russell 1000 Index lead the Russell 2000 Index. Was their rebound from Black Thursday 2020 an economic recovery or a dead cat bounce?
We broke down the returns of the Russell 1000 & 2000 Indices to identify the top and worst performing sectors to investigate the possible causes of this phenomenon.
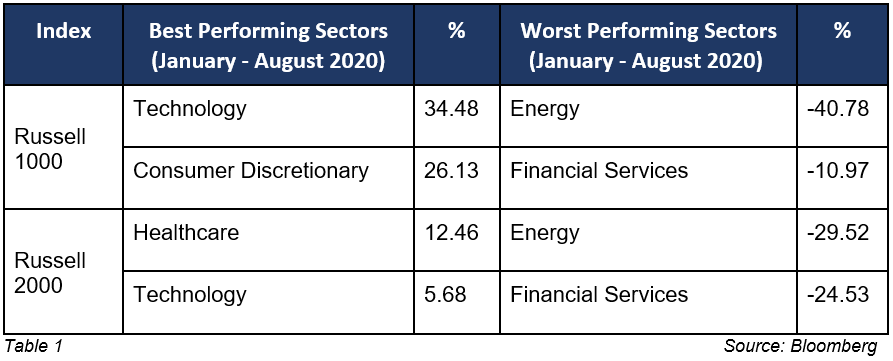
As shown in Table 1, the technology sector in the Russell 1000 Index performed the best. It returned a whopping 34.48%! This came as no surprise, as the various lockdowns from Covid-19 accelerated the pace of digitalisation and deployment of artificial intelligence (AI), cybersecurity and automation. These industries will most likely continue to benefit from the new normal.
The second-best performing sector in the Russell 1000 Index is Consumer Discretionary. This sector has enjoyed double-digit growth rates this year, supported by a recovery in consumer confidence. The Consumer Confidence Index in the US increased from 85.7 in April to 92.6 in July 2020 (Bloomberg).
The Russell 2000 Healthcare sector returned 12.46%, followed by Technology’s 5.68%. The Healthcare sector’s returns could most likely be due to higher demand for medical equipment or anticipation of Covid-19 vaccines in the near future [3].
Weakness in the Energy and Financial Services sectors in both Russell 1000 & 2000 Indices, again, did not surprise us. A plunge in demand dragged down already-low oil prices, making the oil industry one of the biggest casualties during this pandemic. US shale-oil producers were especially hard-hit, as they require a breakeven oil price of around US$50 per barrel [4], while WTI Oil Futures traded at a daily average price of US$33 in the last six months ending August 2020. Financial Services, meanwhile, were plagued by fears of loan impairment and a potential credit crunch.
Analysis of the Russell 1000 & 2000 Indices (Post-Black Thursday 2020)
The lead in the Russell 1000 Index over Russell 2000 Index could be explained by several factors.
1) Monetary and Fiscal Policies
The US government and Federal Reserve (Fed) introduced various aid packages and injected unprecedented levels of liquidity into financial markets. In past years, the Fed would commit a specific amount of US dollars to purchase Treasury Bonds and mortgage-backed securities. In 2020, for the first time in history, it introduced unlimited quantitative easing and moved to purchase large corporate debts through Exchange Traded Funds (ETFs) [5]. This move likely precipitated exuberance among investors, who bought into larger-cap stocks due to their stability and decline in valuations.
2) “The Larger Cap Effect”
Larger equity stocks in the theme of the moment tend to draw the attention of equity research houses. Their research coverage, in turn, generates greater publicity and awareness of the larger-cap companies. This may translate to higher trading liquidity, valuations and index inclusions. Low interest rates coupled with the Covid-19 pandemic may also have driven investors to seek higher yields in equities.
Larger caps are generally deemed by investors as more stable investment choices than smaller-cap stocks. Smaller caps’ perceived risks include a lack of publicly-available information, lack of equity coverage by research houses, corporate-governance concerns and liquidity issues. Financial institutions may also be less willing to offer loans to these companies during adverse times.
3) Investor Sentiment
The stock market is usually considered a leading indicator of the economy. Investors may not have renewed their risk appetite and hence, may have read the March 2020 bull run as a dead-cat bounce as opposed to a full-fledged economic recovery. This factor, combined with monetary and fiscal policies as well as “The Larger Cap Effect”, may have caused the Russell 1000 Index to lead the Russell 2000 Index in returns.
Outlook
Valuations are one of the key factors that investors consider before entering the market.
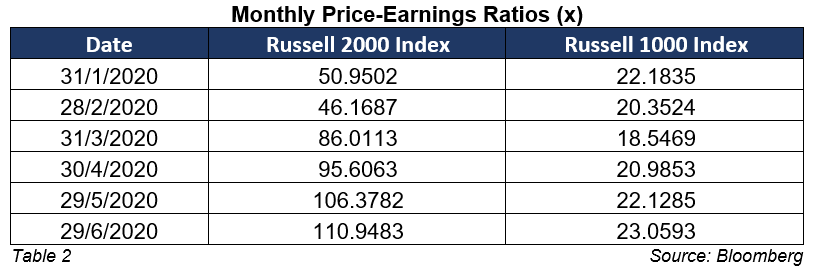
As shown in Table 2, at the end of June 2020, the Russell 1000 Index traded at a Price-Earnings (PE) ratio of 23, up from a multiple of 20 in February 2020, which was its highest before Black Thursday 2020. This implies that valuations for larger-cap equities have hit another historical high. The Russell 2000 Index typically traded at double the PE ratio of Russell 1000 Index before Black Thursday 2020. However, at the end of June 2020, the Russell 2000 Index traded at more than 4x the PE ratio of Russell 1000 Index. Their greater divergence could be due to a greater decline in earnings as compared to a decline in price. It is not uncommon to see the PE ratio of the Russell 2000 Index soaring above 100x during and after a recessionary period.
During the 2008 Global Financial Crisis (GFC), Russell 2000 Index traded at a PE ratio of 690, while Russell 1000 Index traded at 18x. A similar wide divergence was spotted after the dotcom bubble in 2001. If historical data proves to be a reliable indicator, we could see the Russell 2000 Index trading at an extremely high PE multiple from 4Q 2020 onwards. On the other hand, any potential convergence between Russell 1000 & 2000 Indices’ PE multiples could imply that an economic recovery is coming.
The COVID-19 pandemic is hastening the adoption of digitalisation and deployment of AI, cybersecurity and automation. We foresee many small-cap catalysts in a post-COVID-19 world, particularly in the technology sector. Industry consolidation could be one such catalyst, as synergies are a feasible solution for small-cap companies struggling to survive. Therefore, to capitalise on small-cap catalysts, growth prospects and minimise risks, investors should watch out for signs of potential convergence between Russell 1000 and 2000 Indices and hedge their risks using Contract for Differences (CFDs), options or warrants.
References
More Articles
What is FX CFD & Why You Should Trade Them?
Before you plunge right into Forex (FX) CFD trading, please read this article to understand the basic fundamentals of Forex trading and how you can start trading Forex (FX) CFD with us.
Playing the Ratio Game: Gold and Silver

Gold price has surged to Multi-year high recently, generating massive interest in this investment amidst market uncertainties and low interest rates. Read on to find on about the Gold/Silver Ratio.
Understanding Contracts for Difference (CFD)

“What is CFD?” might be a question that has popped up into the minds of those that just recently got acquainted with the concept of investments.
Disclaimer
This material is provided to you for general information only and does not constitute a recommendation, an offer or solicitation to buy or sell the investment product mentioned. It does not have any regard to your specific investment objectives, financial situation or any of your particular needs. Accordingly, no warranty whatsoever is given and not liability whatsoever is accepted for any loss arising whether directly or indirectly as a result of your acting based on this information.
Investments are subject to investment risks. The risk of loss in leveraged trading can be substantial. You may sustain losses in excess of your initial funds and may be called upon to deposit additional margin funds at short notice. If the required funds are not provided within the prescribed time, your positions may be liquidated. The resulting deficits in your account are subject to penalty charges. The value of investments denominated in foreign currencies may diminish or increase due to changes in the rates of exchange. You should also be aware of the commissions and finance costs involved in trading leveraged products. This product may not be suitable for clients whose investment objective is preservation of capital and/or whose risk tolerance is low. Clients are advised to understand the nature and risks involved in margin trading.
You may wish to obtain advice from a qualified financial adviser, pursuant to a separate engagement, before making a commitment to purchase any of the investment products mentioned herein. In the event that you choose not to obtain advice from a qualified financial adviser, you should assess and consider whether the investment product is suitable for you before proceeding to invest and we do not offer any advice in this regard unless mandated to do so by way of a separate engagement. You are advised to read the trading account Terms & Conditions and Risk Disclosure Statement (available online at www.poems.com.sg) before trading in this product.
Any CFD offered is not approved or endorsed by the issuer or originator of the underlying securities and the issuer or originator is not privy to the CFD contract. This advertisement has not been reviewed by the Monetary Authority of Singapore (MAS).
