3 Aspects of Technical Analysis all traders should know!
")


Chua Minghan, Assistant Manager, Dealing
Chua Minghan graduated from the National University of Singapore with a Bachelor’s degree in Economics. He is passionate about education and went on to get a post-grad Diploma in teaching. His vision is to educate clients to make informed decisions for their trading and investments.
Minghan enjoys learning fundamental analysis, technical analysis, and strives to use data analysis to improve his trading skills.
It is common knowledge that trend trading is your friend. This means that you should conduct your trades in the direction of the trend. Trading in the direction of the trend allows you to have a higher probability of profiting from the market.
In this article, you will learn the 3 methods you can use to identify the trend:
-
-
- Price action
- Moving average
- Moving average crossover
-
Method 1: Price Action
Uptrend – Higher Highs and Higher Lows
One method of identifying a trend is through the use of price action. Before making any trades, we need to know the trend first. The trend can range from an uptrend to downtrend and on some days, sideways.
Below are the definitions of the 3 types of trends:
a) Uptrend – when prices make higher highs and higher lows
b) Downtrend – when prices make lower highs and lower lows
c) Sideways trend – horizontal price movements

Source: Phillip CFD [1]
The graph above, features an uptrend; notice the higher highs and higher lows. This uptrend signals to investors that prices are in an uptrend, favouring investors who are buying the shares. In this case, investors should invest and profit from the trade when they notice the prices moving in an uptrend.
Downtrend – Lower Highs and Lower Lows

Source: Phillip CFD [2]
In the graph above, you can see a pattern of lower highs and lower lows. Unless you are shorting the market, you should ideally stay out of it and refrain from buying the stock. Shorting the market refers to profiting when prices go down. For traders who short the market using CFDs, they hold the view that prices will continue to go down. In the current market environment as of June 2022, most markets are down and traders can profit by shorting the markets.
Method 2: Moving Average
A moving average is the average of prices for a specified number of days. If the trend is up, the average price should be up as well. With the help of moving averages, we can better filter out the noise.

Source: POEMS 2.0
To tell the trend with moving averages, 2 important things must be noted:
#1 Prices are above the Moving Average (MA).
#2 The Moving Average is sloping up.
The image above is for the stock Frencken (SGX:E28). It is on an uptrend, given that there are higher highs and higher lows. Though the trend is up, the prices do not move up in one straight line. The movement whips up and down, making higher highs and higher lows as it moves up. The 50-day moving average is shown in the image above. Each point on the line is the average price for the previous 50 days. Most professional traders use a 50-day moving average, also known as 50-day MA.

Source: POEMS 2.0
The same concept is used for downtrends. Above is an image of the stock Sembcorp Marine (S51: SGX). The prices are below the 50-day MA, with the MA sloping down. This signals that the stock is on a downtrend and profitability would be more probable if investors choose to short the stock.
Method 3: Moving Average Crossover

Source: POEMS 2.0
At times, prices may move above the MA and back down in a sideways manner. This tells us that the trend is neither up nor down. When prices are going sideways, it can be misleading for investors, making it more difficult to identify the trend when prices move above or below the 50-day MA.

Source: POEMS 2.0
The third method that traders use is the moving average crossover. The above image shows DBS bank’s (D05: SGX) chart with a 200-day and 50-day MA. The 200-day MA is illustrated in red and the 50-day MA in blue. When the 50-day MA crosses above the 200-day MA, we deem it as an uptrend. When it crosses below, we deem it as a downtrend. The 50-day MA crossed above the 200-day MA, followed by the MAs moving upwards to confirm the uptrend.

Source: POEMS 2.0
Above is an image of Dairy Farm stock (D01: SGX). The 50-day MA crossed below the 200-day MA, followed by the MAs moving downwards to confirm the downtrend.
Application – When To Enter?
Applying the methods above, investors gain a bias to long or short as a starting point. This method prevents them from speculating unnecessarily or buying and selling without knowing their basis for entry.

Source: POEMS 2.0
There will be times when the direction bias is correct, a stock is bought, and yet prices move against investors after the trade. It can be a very frustrating experience. With this understanding, knowing how to identify the trend correctly and the moving average crossover, can help to prevent such experiences.
Applying the 50-day and 200-day MA on the Frencken (E28: SGX) chart above, the 50-day MA has already crossed above the 200-day MA. Both lines are sloping to the up side so we know that it is on an uptrend. A good time to enter would be when prices touch or move below the 50-day MA and close above it, while staying above the 200-day MA. Any investor who believes Frencken is a good company would have made at least 80% in the period of 2020-2021.
Conclusion
A short recap of the 3 methods to identify:
Uptrends
#1. Higher highs and higher lows (lower highs and lower lows)
#2. Prices above MA (below MA) and sloping up (sloping down)
#3. 50-day MA crosses above 200-day MA, while sloping upwards
Downtrends
#1.Lower highs and lower lows
#2. Prices below the MA and sloping downwards
#3. 50-day MA crosses below the 200-day MA, while sloping downwards
Losses are part of trading and investing. Hence, it is paramount to have a systematic approach. Many speculators enter the market without a system, resulting in unnecessary losses. Using moving average methods to identify the trend gives investors and traders a good starting point to decide whether to buy or sell.
How to get started
As the pioneer of Singapore’s online trading, POEMS’ award-winning suite of trading platforms offers investors and traders more than 40,000 financial products across global exchanges.
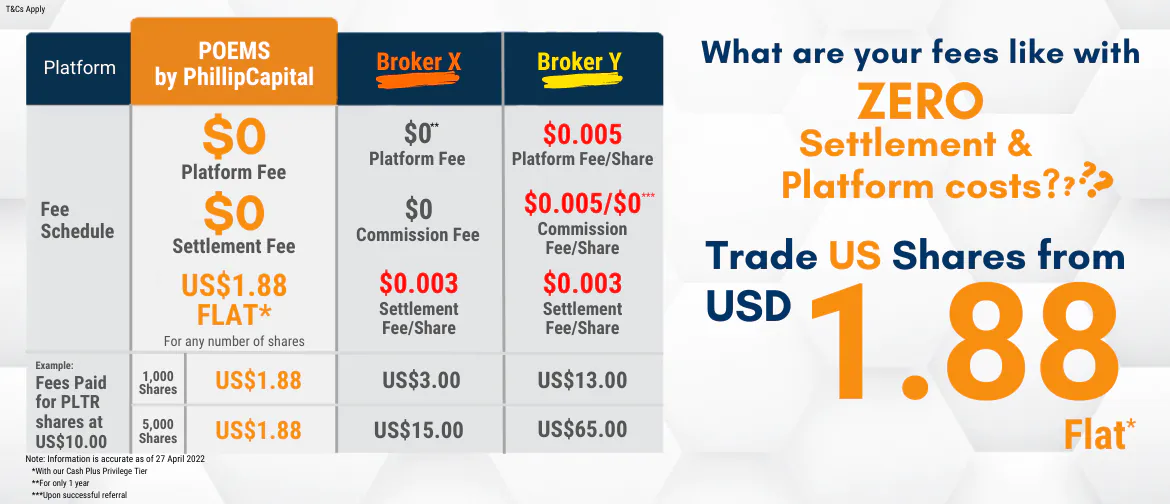
Explore an array of US shares with brokerage fees as low as US$1.88 flat* when you open a Cash Plus Account with us today. Find out more here. T&Cs apply.
We hope that you have found value from reading this article! If you do not have a POEMS account, you may visit here to open one with us today!
Lastly, you can learn from investing in a community. Join our community and interact with us and other seasoned investors who often share their experience and expertise.
You will also have access to quality educational materials, stock analysis to help you in applying concepts, and even post to ask questions!
We look forward to sharing more insights with you in our growing and enthusiastic Telegram community. Join us now!
For enquiries, please email us at cfd@phillip.com.sg.

Trade Smarter and Faster
With our newly launched POEMS Mobile 3 Trading App
Explore a myriad of useful features including TradingView chartings to conduct technical analysis with over 100 technical indicators available!
Take this opportunity to expand your trading portfolio with our wide range of products including Stocks, CFDs, ETFs, Unit Trusts and more across 15 global exchanges available for you anytime and anywhere to elevate you as a better trader using our POEMS Mobile 3 App!


More Articles
The Power of Leverage in CFD
")
What is leverage? Read our article to find out more about the different uses of leverage through the use of Contract for Differences (CFDs) for both traders and long-term investors.
Why You Should Consider Dividend Investing
")
Have you tried dividend investing? Learn more about why you should consider dividend investing!
A Value(able) ETF During Rate Hikes
")
Interested in buying valuable ETFs? Read on our article to find out more!
Disclaimer
This material is provided to you for general information only and does not constitute a recommendation, an offer or solicitation to buy or sell the investment product mentioned. It does not have any regard to your specific investment objectives, financial situation or any of your particular needs. Accordingly, no warranty whatsoever is given and not liability whatsoever is accepted for any loss arising whether directly or indirectly as a result of your acting based on this information.
Investments are subject to investment risks. The risk of loss in leveraged trading can be substantial. You may sustain losses in excess of your initial funds and may be called upon to deposit additional margin funds at short notice. If the required funds are not provided within the prescribed time, your positions may be liquidated. The resulting deficits in your account are subject to penalty charges. The value of investments denominated in foreign currencies may diminish or increase due to changes in the rates of exchange. You should also be aware of the commissions and finance costs involved in trading leveraged products. This product may not be suitable for clients whose investment objective is preservation of capital and/or whose risk tolerance is low. Clients are advised to understand the nature and risks involved in margin trading.
You may wish to obtain advice from a qualified financial adviser, pursuant to a separate engagement, before making a commitment to purchase any of the investment products mentioned herein. In the event that you choose not to obtain advice from a qualified financial adviser, you should assess and consider whether the investment product is suitable for you before proceeding to invest and we do not offer any advice in this regard unless mandated to do so by way of a separate engagement. You are advised to read the trading account Terms & Conditions and Risk Disclosure Statement (available online at www.poems.com.sg) before trading in this product.
Any CFD offered is not approved or endorsed by the issuer or originator of the underlying securities and the issuer or originator is not privy to the CFD contract. This advertisement has not been reviewed by the Monetary Authority of Singapore (MAS).
