3 Powerful Risk-Management Strategies Using Technical Analysis


Published On: 9 Mar 2021 | 12:00 PM
Lee Yong Shern, CFD Dealer
Yong Shern is a passionate Contract for Differences (CFD) dealer who has always aspired to discover trading opportunities using a blend of different research methodologies. Prior to joining PhillipCapital, he was an intraday equity trader in one of the top brokerage firms in Malaysia. He graduated with First Class Honours in Business Administration with a major in Banking and Finance from the University of Malaya. Yong Shern is experienced in both trading and research in various financial products. These products include equities, indices, commodities, forex trading. He has successfully crafted trading strategies to navigate this volatile oil environment.
In his free time, Yong Shern enjoys following the latest market news with the aim of helping clients navigate through various market conditions.
What this article is about:
- Risk management is crucial in Contract for Differences (CFD) trading regardless of long or short positions. A big portion of risk management is knowing when to cut losses and when to let profits run.
- Investors and traders usually stumble over four hurdles when implementing risk management: they expect a rebound, they lack a trading plan, they have an overconfidence bias and there is insufficient monitoring.
- Technical analysis can offer you three risk-management strategies.
“I’m only rich because I know when I’m wrong…I basically have survived by recognizing my mistakes.”
George Soros, founder of Soros Fund Management and co-founder of Quantum Fund
Many traders have probably heard of the golden rule of risk management in stock trading: cut your losses early and let your profits run. To be a profitable trader, it is essential to have a proper risk-management framework. A big portion of risk management is knowing when to cut your losses and when to let your profits run.
Risk of capital loss is inevitable when you trade financial products such as CFDs as trading on leverage can magnify profits and losses. The question one should ask is not whether there will be losses but at what magnitude?
On the surface, the golden rule of cutting your losses early and letting your profits run sounds easy-peasy. In reality, many investors and traders find it hard to apply due to many of our inherent heuristic biases. One big bias humans face is loss aversion. Loss aversion is when the one who loses S$100 feels a greater pinch than one who wins S$100. Losses tend to have a stronger impact on us than wins.
4 common risk-management hurdles
1. Expecting a rebound
The share price of Stock X is hitting my cut-loss point. From its price charts, I reckon it should rebound soon. I will continue to hold and lower my cut-loss point.
Sounds familiar? Investors tend to drop their cut-loss prices – for long positions – when share prices approach their cut-loss prices. This undisciplined behaviour may lead to excessive losses!
Share prices do not always trade within the range of your cut-loss levels. Prices may not rebound even after hitting their previous lows. Financial markets are a leading indicator of the economy and a counter’s fundamentals may change. They often do, in fact!
2. No trading plan
When the market turns against investors and traders, those without sound trading plans often hesitate to liquidate their positions and some execute their trades based on their instincts as they fear losing money. Some may even cling on to their positions for years, hoping for a rebound in some near future. In this way, they lose out on other opportunities
3. Overconfidence bias
“All of us are imperfect beings living in an imperfect world.”
Haruki Murakami
Some investors and traders plough 100% of their capital into a trade with utmost confidence. When prices move against them, they refuse to cut losses and hope that prices will crawl back to profit levels in the near future. Overtime, their losses snowball and their capital may be wiped out.
Financial markets are inherently complex and ever-changing. Due to time and informational constraints, most retail investors have difficulties trying to form a complete picture of an industry or a counter – unless they have years of industry experience or knowledge in the sectors or stocks they are investing in.
4. Insufficient monitoring
One of the biggest constraints retail investors face is time. Most of us have to juggle work, family and social life with investing. Busyness keeps us away from close monitoring of our portfolios. While working on the CFD dealing desk, we have encountered clients who forgot the holdings in their portfolios.
Retail investors and traders should consider using advanced order types to automate their risk-management strategies. Check out our article on OCO Orders.
Using technical analysis to manage your risks
Protect the downside and the upside will take care of itself
Donald J Trump; 45th US President
A common question asked by many of our clients is:
So, what are the stepping stones to an effective risk-management framework? What indicators should I use to determine my cut-loss points?
Investors and traders can start off by identifying chart patterns. A word of caution, though. Chart patterns are imperfect. No chart pattern can be a 100% foolproof trading and risk-management indicator. What technical indicators do for you is to assist you in identifying your entry and exit positions. This gives you the confidence to execute trades and manage your risks.
Below are some real-life instances of how technical analysis helped me and my team make more informed trading decisions and manage our risks better. The charts only serve as references; be reminded again that none is perfect or accurate all the time.
1) Support and resistance
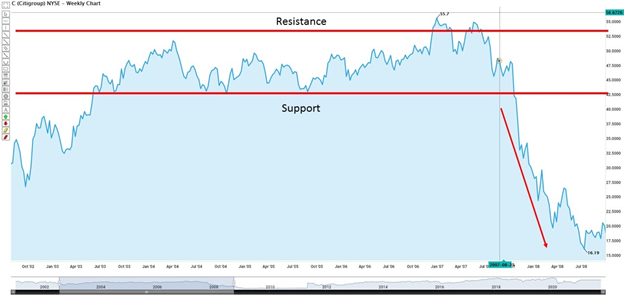
Figure 1: CITIGROUP’s (US) 2003 -2007 weekly chart
CITIGROUP INC (C)
Buy at support and sell at resistance is one of the widely-used strategies in trading. Support is the price level at which demand is strong enough to prevent the price from declining further [1]. The price will normally rebound from that price point or zone. The stock may trade within a channel, which is its price range. Those who use the buy-at-support strategy will have to place their cut-loss below the support region. If the price breaks below the support point, this signals that the bears are in control. You may then set your cut-loss point below the support zone to manage your risk as the price is expected to slide in the near term.
Figure 1 shows Citigroup trading in the range of US$424 to US$531. Its share price started to break below the support point of US$424 in October 2007. It has traded way below that range since!
2) Head and Shoulders

Figure 2: SATS’ (SGX) 2016 to 2020 monthly chart
SATS (S58)
Head and Shoulders is a reversal pattern formed after a bull run. Its completion will mark a trend reversal, that is to say, the beginning of a bear run. It contains three successive peaks. The highest is the middle peak, known as the head. Two lower peaks on both sides are the shoulders. The lows for these peaks are roughly equal, forming a support or neckline [2].
The formation of Head and Shoulders is only completed when the neckline is broken. The neckline for SATS was at the S$4.60 level. The price fell below that level in January 2020, marking the completion of Head and Shoulders. From Figure 2, you can see the continuation of that slide. Investors are advised to react once the formation of Head and Shoulders is completed.
3) Double Top Reversal
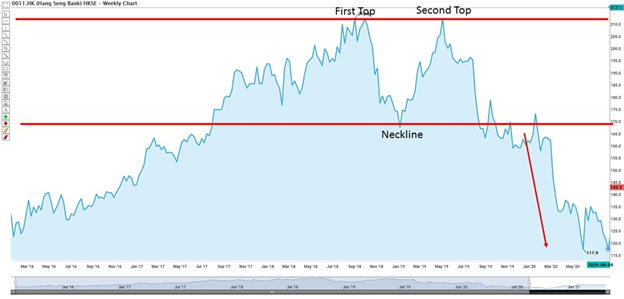
Figure 3: Hang Seng Bank’s (HKEX) 2018 to 2019 weekly chart
Hang Seng Bank (0011)
Double Top Reversal is a bearish reversal pattern made up of two consecutive peaks that are roughly equal. Its formation marks the reversal of an uptrend in the immediate term if not long term. It is only confirmed when its neckline is broken, which means its support is broken [3].
Hang Seng Bank’s price chart in Figure 3 illustrates a Double Top Reversal. The formation of this pattern is only completed when its neckline or support at 166 is genuinely broken. The price of Hang Seng Bank went down to HKD117 at the end of 2020.
To sum it up
Truth be told, it is very mentally challenging if you have to cut your trading losses. The skill in handling losses differentiates the successful investor from the not-so-successful investor. Understanding and spotting chart patterns can help you manage risks better and develop your unique trading style. It can also protect your downside and preserve your capital.
We sincerely hope that you have found this article valuable.
Please feel free to email us at cfd@phillip.com.sg if you have any queries. PhillipCapital offers various advanced order types to facilitate your risk management on POEMS. To find out more, visit our website. Do note that not all advanced orders are guaranteed fulfilled, subjected to market volatility and other factors.
Trade on our award-wining suite of POEMS Platform. Open a CFD Account now!
More Articles
The Opportunities in China's New Economy

What are the opportunities that investors could look for in the China’s new economy? Read our latest article to find out more about the China market!
Take advantage of Volatility! Embrace it, Don't Fear it!

2020 has been an eventful year which has led to spikes in market volatility. Ride on the wave of volatility and learn how you can take advantage of the volatility by trading CFDs
US Small Caps as an Economic Barometer?

Did you know that US small-cap stocks are often perceived as a reliable economic barometer of US economic activity? Read this article to learn more!
Disclaimer
This material is provided to you for general information only and does not constitute a recommendation, an offer or solicitation to buy or sell the investment product mentioned. It does not have any regard to your specific investment objectives, financial situation or any of your particular needs. Accordingly, no warranty whatsoever is given and not liability whatsoever is accepted for any loss arising whether directly or indirectly as a result of your acting based on this information.
Investments are subject to investment risks. The risk of loss in leveraged trading can be substantial. You may sustain losses in excess of your initial funds and may be called upon to deposit additional margin funds at short notice. If the required funds are not provided within the prescribed time, your positions may be liquidated. The resulting deficits in your account are subject to penalty charges. The value of investments denominated in foreign currencies may diminish or increase due to changes in the rates of exchange. You should also be aware of the commissions and finance costs involved in trading leveraged products. This product may not be suitable for clients whose investment objective is preservation of capital and/or whose risk tolerance is low. Clients are advised to understand the nature and risks involved in margin trading.
You may wish to obtain advice from a qualified financial adviser, pursuant to a separate engagement, before making a commitment to purchase any of the investment products mentioned herein. In the event that you choose not to obtain advice from a qualified financial adviser, you should assess and consider whether the investment product is suitable for you before proceeding to invest and we do not offer any advice in this regard unless mandated to do so by way of a separate engagement. You are advised to read the trading account Terms & Conditions and Risk Disclosure Statement (available online at www.poems.com.sg) before trading in this product.
Any CFD offered is not approved or endorsed by the issuer or originator of the underlying securities and the issuer or originator is not privy to the CFD contract. This advertisement has not been reviewed by the Monetary Authority of Singapore (MAS).
