Beating the Efficient Market Hypothesis

 Tan Chek Ann, Senior Dealer
Published On: 29 August 2018 | 11:30 AM
If you have any sort of finance background, you will probably have heard of the Efficient Market Hypothesis (EMH). It’s an economic theory that states that all available information are reflected in the prices. Any pricing inefficiencies are quickly arbitraged away by the others. No fundamental or technical analysis will consistently produce superior returns to the market. EMH proponents believe that we will be better off holding an index fund, being the market, rather than trying to beat the market.
A running joke on EMH goes as such:
A economist (EMH proponent) and a friend were walking along the street. The friend stops and says, “Look, there is a $100 note on the ground!” The economist without flinching, replies, “Impossible! If there was a $100 bill on the ground, somebody would have already picked it up!” and carries on walking.
I’m not sure about you, but I will definitely (at least) sneak a peek at whether free $100s can be found on the grounds. One such rhetoric $100 is a personal interest of mine: momentum premium.
Momentum is a market anomaly where stocks that have done well (or poorly) in the past, will likely continue to do well (or poorly) in the short future. Momentum has been described as a powerful and persistent market anomaly. If you are a die-hard Graham and Dodd value guy, momentum may be counter intuitive to you also.
Interestingly, a EMH guy holding a S&P 500 index fund is adopting some sort of momentum. Losers are systematically kicked out of the index and replaced with new winners. Your result is a constantly rebalanced group of 500 winners with an upward bias in price. Going further, as the share price of the individual index component goes up, say AAPL, their market capitalization goes up. Index tracking funds will have to purchase more AAPL, their market capitalization goes up. Index tracking funds will have to purchase more AAPL shares to maintain their weightage within the index, pushing their share price even higher. The up goes higher.
1. No Fluff, No Bluff

Yes there are ALREADY many academic papers on momentum (Jegadeesh & Titman 1993 comes to mind). But for a stronger sense of conviction, I needed to conduct at least one (I did many) experiment, to go through the full journey and generate the results myself. For seeing IS believing.
Hypothesis: The best performing stocks in the past will continue to be the best performing stocks in the future.
We define “in the past” as Lookback Period, X number of months into the past. Suppose it is Aug 2018 now, a 6 months lookback period will be from Feb to Aug 2018. “in the future” is the Holding Period, Y number of months from now.
We quantify and measure “best performing in the past” as the top decile of total returns in the sampled universe, termed Q1. Q2 will be the next 10%… until Q10, the bottom 10%.
“Best performing in the future” is simply measuring total returns from now till Y months later.”
2. So measure and buy Q1 since X months, hold for Y months then rebalance.. Not rocket science right?

I chose 3, 6 and 12 months as Lookback Periods and 1, 3 and 6 months as Holding Periods.
The sampled universe is NYSE, NASDAQ, and NYSE MKT. As a proxy for liquidity, only companies with market capitalization of at least USD 200 million is included. I’ve also removed ETF, ETN, REITS, ADR from the universe.
Sampled period is 22 years from Jul 1996 to Jun 2018. To prevent seasonality, combinations with 6 months holding periods are done twice, 6m A rebalanced in April/Oct and 6m B rebalanced in Jan/Jul.
This gives us 12 possible combinations and their results:
| CAGR (%) |
| Lookback Period | Holding Period | Q1 (Winners) | Q10 (Losers) | Q Spread (Q1-Q10) |
| 6m | 1m | 15.41% | 1.04% | 14.37% |
| 6m | 3m | 14.28% | -0.08% | 14.36% |
| 6m | 6m B | 12.77% | 2.09% | 10.68% |
| 12m | 1m | 12.45% | 1.68% | 10.77% |
| 6m | 6m A | 11.69% | -0.68% | 10.77% |
| 3m | 1m | 10.95% | 3.79% | 7.16% |
| 12m | 3m | 9.83% | 2.89% | 6.94% |
| 3m | 6m B | 9.81% | 3.18% | 6.63% |
| 3m | 6m A | 8.64% | 1.01% | 7.63% |
| 12m | 6m B | 8.20% | 4.78% | 3.42% |
| 3m | 3m | 7.79% | 3.80% | 3.99% |
| 12m | 6m A | 6.17% | 2.80% | 3.37% |
| S&P 500 | 9.05% |
| All data from Bloomberg |
3. Like an avocado. Too soon, not ripe. Too long, too ripe.

So we see.. Winners does outperform losers! Momentum does exist.
Q Spread measures the difference between the highest and lowest deciles (Q1 – Q10) and is positive across all combinations!
However the outperformance varies across different LP/HP combinations. We find:
A. Momentum is an avocado. It has a narrow window for optimal consumption.
A 6 months lookback period seems to be the ideal, producing double digit Q1 and Q Spreads.
3 months and momentum is not ripe. 12 months and momentum gets too ripe, especially if paired with a longer holding period.
B. The ideal holding period is more diverse. Shorter holding periods (1 to 3 months) seems to outperform, as long as momentum is properly formed.
The top 5 performing combinations plotted against S&P 500 in an equity curve looks like this:
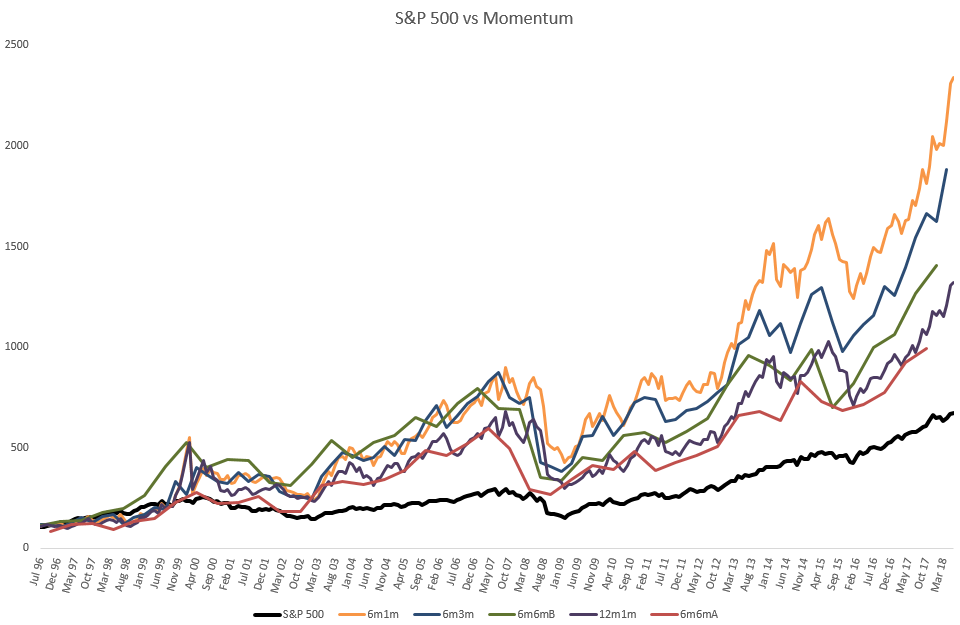
So we have.. Momentum busting the EMH. Our first of many rhetorical $100s to be found. And I suspect the same model applied on Chinese or developing markets may produce better results.
4. So what now?

In closing, I would like add: There is obviously no perfect system that works ALL THE TIME. The lesson to be drawn here is the basic momentum model that will serve as the backbone of our future strategies to revolve around.
*(Please note that the information contained in this article is provided to you for educational purposes only. information or opinions provided in this email do not constitute an investment advice.)
See you all next time!
More Articles
Malaysia Election Part 2

As highlighted in the previous article, the run-up to the 14th general election (GE14) of Malaysia does not differ much from previous elections whereby Budget 2018 focuses on…
Malaysia Election Part 1

Malaysia is preparing for a general election. How will this affect the Malaysian economy? First, let us take a look at how the Malaysian Economy has transformed over the years.
Stock Market Crash?

Malaysia is preparing for a general election. How will this affect the Malaysian economy? First, let us take a look at how the Malaysian Economy has transformed over the years.
Disclaimer
This material is provided to you for general information only and does not constitute a recommendation, an offer or solicitation to buy or sell the investment product mentioned. It does not have any regard to your specific investment objectives, financial situation or any of your particular needs. Accordingly, no warranty whatsoever is given and not liability whatsoever is accepted for any loss arising whether directly or indirectly as a result of your acting based on this information.
Investments are subject to investment risks. The risk of loss in leveraged trading can be substantial. You may sustain losses in excess of your initial funds and may be called upon to deposit additional margin funds at short notice. If the required funds are not provided within the prescribed time, your positions may be liquidated. The resulting deficits in your account are subject to penalty charges. The value of investments denominated in foreign currencies may diminish or increase due to changes in the rates of exchange. You should also be aware of the commissions and finance costs involved in trading leveraged products. This product may not be suitable for clients whose investment objective is preservation of capital and/or whose risk tolerance is low. Clients are advised to understand the nature and risks involved in margin trading.
You may wish to obtain advice from a qualified financial adviser, pursuant to a separate engagement, before making a commitment to purchase any of the investment products mentioned herein. In the event that you choose not to obtain advice from a qualifies financial adviser, you should assess and consider whether the investment product is suitable for you before proceeding to invest and we do not offer any advice in this regard unless mandated to do so by way of a separate engagement. You are advised to read the trading account Terms & Conditions and Risk Disclosure Statement (available online at www.poems.com.sg) before trading in this product.
Any CFD offered is not approved or endorsed by the issuer or originator of the underlying securities and the issuer or originator is not privy to the CFD contract. This advertisement has not been reviewed by the Monetary Authority of Singapore.
