Fibonacci Retracement: 2 Practical Ways To Trade The Markets


Chua Minghan, Senior Manager, Dealing
Chua Minghan graduated from the National University of Singapore with a Bachelor’s degree in Economics. He is passionate about education and went on to get a post-grad Diploma in teaching. His vision is to educate clients to make informed decisions for their trading and investments.
Minghan enjoys learning fundamental analysis, technical analysis, and strives to use data analysis to improve his trading skills.
Overview
It’s frustrating to be stopped-out of a trade, even for an experienced trader like me. There are numerous occasions where I find myself stopped-out of a trade before I could realise my profits due to inconsistent trade management.
As good practice for any trader, I did a comprehensive review of my trading history, and found that 20% of my trades were attempted when the market did not move in my favour, resulting in immediate stop-outs. Conversely, another 20% of my trades reached the target profit I had set. On the remaining occasions, the trades initially moved in my favour before ultimately hitting the stop-loss.
Although it was discouraging, the finding held the potential for improvement. How, you might wonder? The answer lies in the Fibonacci Retracement. In this article, I will elucidate this tool’s history, the theory behind it as well as its application on trading scenarios to help readers like you, to understand how to use the Fibonacci Retracement to manage your trades.
History
Before jumping straight into the usage of the Fibonacci Retracement, it is better to understand the history behind it. For those who might not know, the Fibonacci Retracement was named after Fibonacci, an Italian mathematician from the 13th century, renowned for his work on the Fibonacci sequence. Sounds familiar? Perhaps the following set of numbers might jog your memory:
1, 1, 2, 3, 5, 8, 13, 21, 34….
If you have not figured it out, this sequence follows a specific formula, where each number is the sum of the two preceding numbers. For instance, 13 is the result of adding 8 and 5, while 21 is derived from the addition of 8 and 13. This sequence has significant applications in various fields, including trading and technical analysis. The theory behind it lies with another renowned concept, the Golden Ratio.
Often represented by the Greek letter φ (phi), the Golden Ratio is an irrational number approximately equal to 1.618. It is a mathematical constant that is often associated with aesthetically pleasing proportions and patterns. It can be seen in the dimensions of ancient Greek architecture, famous paintings like the Mona Lisa, and even in natural phenomena such as the spiral arrangement of sunflower seeds or the branching of trees. So how does it link to the Fibonacci sequence?
Observing the sequence mentioned earlier, the ratio can be derived by dividing the Fibonacci numbers. As the sequence progresses, the result of each division approaches 1.618. In the reverse direction, the result of each division converges to 0.618. This observation has led many to believe that Fibonacci is intricately linked to the Golden Ratio.
As a result, this connection has fostered the belief that the Fibonacci Golden Ratio is a fundamental aspect of nature and because markets are influenced by human behaviour, the stock market tends to exhibit traces of Fibonacci’s influence. The Fibonacci Retracement is one such tool that takes advantage of this connection.
Application
Traders employ Fibonacci Retracements as a method to pinpoint potential support and resistance levels based on the Fibonacci Golden Ratio. This tool helps calculate the percentage of a price move and the price levels the move tends to retrace to.
To illustrate, if a stock has surged by 100 points, a Fibonacci Retracement of 50% would denote a level 50 points below the high. Traders hold the belief that these levels frequently serve as areas where the market encounters support or resistance in accordance with the Golden Ratio.
I will use the S&P500 ETF as an example:
Since the Fibonacci Retracement calculates the percentage of a price move, I will use the ETF’s 2022 price movement by connecting the year’s high and low. Let us observe how prices respond in 2023.

Notice how prices hover, get rejected, and find support at these key levels highlighted by the Fibonacci Retracement (blue box). More specifically, observe how the 38.2% retracement level at the bottom is playing the role of a resistance level before prices broke through and found support at that level in May 2023 instead.
Most professional traders who trade with the trend would be buying or getting ready to buy in May at the 38.2% level because the trend is already showing a higher high and higher low. This feature of the Fibonacci Retracement can be further amplified by understanding another concept-confluence.
Confluence
I used to draw support and resistance levels to help guide my trades, but the results were mixed with several hits and misses. In fact, there were actually more misses than hits, causing me to doubt my ability to identify key levels. Trading off the support and resistance levels did not seem to be enough.
Here’s how the Fibonacci Retracement came into play. After I was introduced to it, I experimented with the Fibonacci Retracement tool and surprisingly found several occasions where the Fibonacci levels coincided with some of my own support and resistance levels. This confluence of levels worked much better. I now had two forms of evidence to show that the supply and resistance levels identified from the overlaps are likely to be key levels. This in return boosts my confidence and bolsters my trading psychology.
Trade management
Using the S&P500 ETF as an example again, I will explain another way I use the Fibonacci Retracement.
Let us say we took a trade on 1 June 2023 because prices broke the resistance level in February 2023 and rebounded. The prices moved up, and from 5 to 8 June, they seemed to be hovering sideways. In such a scenario, traders are usually presented with two paths, should you take profits or continue to ride the trend? And if you want to ride the trend further, how do you do so?
Here is how you can utilise the Fibonacci Retracement. By drawing a Fibonacci Retracement from the swing low to the current swing high, you can use the Fibonacci levels as a reference point to shift your trade’s stop loss.

If this is a strong trend, prices should not retrace by more than 50%. This means you can manage your trade by shifting your stop losses to slightly below the 50% retracement level. In this example, this would mean shifting your stop loss to the 50% retracement level at $420.
As we entered the trade at $410 in our example, with the shift of this stop loss, you are now profitable even if things go south. Otherwise, if the uptrend persists, you can continue to shift your stop loss and achieve a better risk to reward ratio.
Conclusion
In summary, I trust that this article has elucidated how to employ the Fibonacci Retracement to discover confluence in key levels, enhance trade management, and bolster your trading psychology. It’s intriguing to observe how human behaviour can manifest in market patterns through the utilisation of the Fibonacci Golden Ratio. It is imperative to acknowledge that such tools do not offer absolute guarantee. As traders, we must diligently do our research before initiating a trade. Nevertheless, Fibonacci Retracement is still a valuable tool to complement your trading strategies.
Promotions

From 2 October to 29 December 2023, enjoy up to S$120 cash credits every month and earn up to S$360 cash credits when you trade FX CFDs for 3 consecutive months (October, November and December). Start trading today!
*T&Cs Apply.
For more information, click here.
How to get started with POEMS
As the pioneer of Singapore’s online trading, POEMS’s award-winning suite of trading platforms offers investors and traders more than 40,000 financial products across global exchanges.
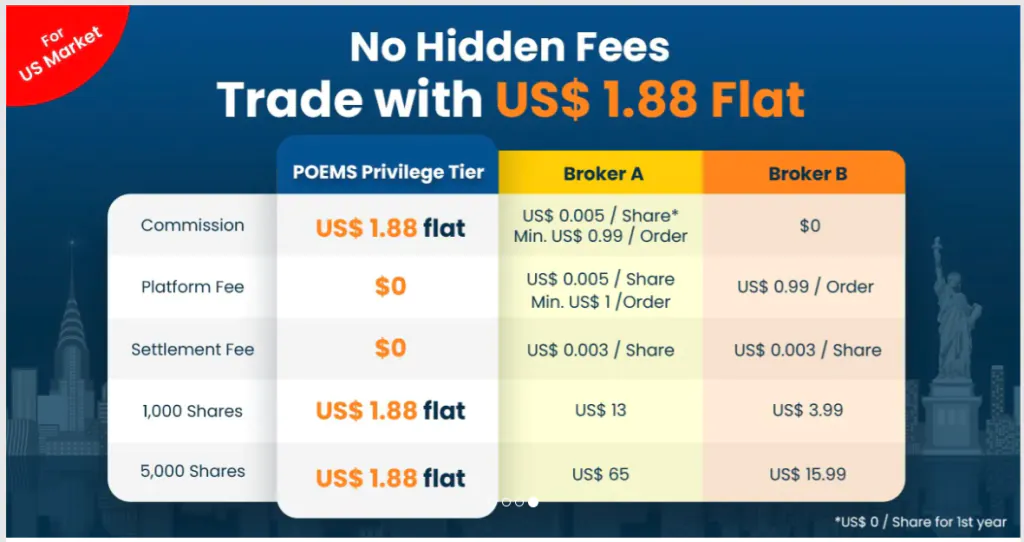
Explore an array of US shares with brokerage fees as low as US$1.88 flat* when you open a Cash Plus Account with us today. Find out more here (terms and conditions apply).
We hope that you have found value reading this article. If you do not have a POEMS account and are interested in trading, you may visit here to open an account with us today.
Lastly, investing in a community can be a highly rewarding experience. Here, you will have the opportunity to interact with us and other seasoned investors who are enthusiastic in sharing their experience and expertise whether it’s through listening or answering questions.
In this community, you will also gain exposure to quality educational materials and stock analysis, to help you appreciate the mindset of seasoned investors and apply concepts you have learned.
We look forward to sharing more insights with you in our growing and enthusiastic Telegram community. Join us now!
For enquiries, please email us at cfd@phillip.com.sg.
More Articles
The Power of Leverage in CFD
")
What is leverage? Read our article to find out more about the different uses of leverage through the use of Contract for Differences (CFDs) for both traders and long-term investors.
Why You Should Consider Dividend Investing
")
Have you tried dividend investing? Learn more about why you should consider dividend investing!
A Value(able) ETF During Rate Hikes
")
Interested in buying valuable ETFs? Read on our article to find out more!
Disclaimer
This material is provided to you for general information only and does not constitute a recommendation, an offer or solicitation to buy or sell the investment product mentioned. It does not have any regard to your specific investment objectives, financial situation or any of your particular needs. Accordingly, no warranty whatsoever is given and not liability whatsoever is accepted for any loss arising whether directly or indirectly as a result of your acting based on this information.
Investments are subject to investment risks. The risk of loss in leveraged trading can be substantial. You may sustain losses in excess of your initial funds and may be called upon to deposit additional margin funds at short notice. If the required funds are not provided within the prescribed time, your positions may be liquidated. The resulting deficits in your account are subject to penalty charges. The value of investments denominated in foreign currencies may diminish or increase due to changes in the rates of exchange. You should also be aware of the commissions and finance costs involved in trading leveraged products. This product may not be suitable for clients whose investment objective is preservation of capital and/or whose risk tolerance is low. Clients are advised to understand the nature and risks involved in margin trading.
You may wish to obtain advice from a qualified financial adviser, pursuant to a separate engagement, before making a commitment to purchase any of the investment products mentioned herein. In the event that you choose not to obtain advice from a qualified financial adviser, you should assess and consider whether the investment product is suitable for you before proceeding to invest and we do not offer any advice in this regard unless mandated to do so by way of a separate engagement. You are advised to read the trading account Terms & Conditions and Risk Disclosure Statement (available online at www.poems.com.sg) before trading in this product.
Any CFD offered is not approved or endorsed by the issuer or originator of the underlying securities and the issuer or originator is not privy to the CFD contract. This advertisement has not been reviewed by the Monetary Authority of Singapore (MAS).
