World Gold Day


Jeremy Chua, Dealer
Jeremy graduated from Nanyang Technological University with a Bachelor’s Degree in Business, specializing in Banking & Finance. Coming from a finance education background as well as being a former banker, he strongly believes in the importance of staying invested in the financial markets and reading consistently to make informed investment decisions.
In his free time, he enjoys reading finance-related books as well as generating new investment ideas.
He is currently the chief editor of the HQ education series that aims to equip clients with tools and skill sets to make better investing and trading decisions.
What this report is about:
- On this day that celebrates the lustrous yellow metal, we look at what makes gold so special as compared to other asset classes throughout history, even till today.
- Understanding the factors that really drive gold prices as the factors that correlate with gold prices may not be as intuitive as they seem.
- Exploring the different ways to gain exposure to gold for your investment portfolio and find one that fits your investment objectives and risk profile.
Did you know that World Gold Day falls on 20 Oct? Unlike other asset classes, gold has come a long way, as both a medium of exchange and a store of wealth due to its attributes of beauty and malleability; it is the most malleable and ductile of all the elements and a single gram can be beaten into a one square meter sheet of gold leaf.
As a physical commodity with limited supply, its value cannot be diluted by inflation, interest rate decisions by a government or fresh currency creation, making it a safe haven asset for investors to flock to during times of market turbulence. In fact, the chart below illustrates how gold has performed as compared to the stock and bond market (represented by the S&P 500 Total Return Index) during periods of market turmoil.
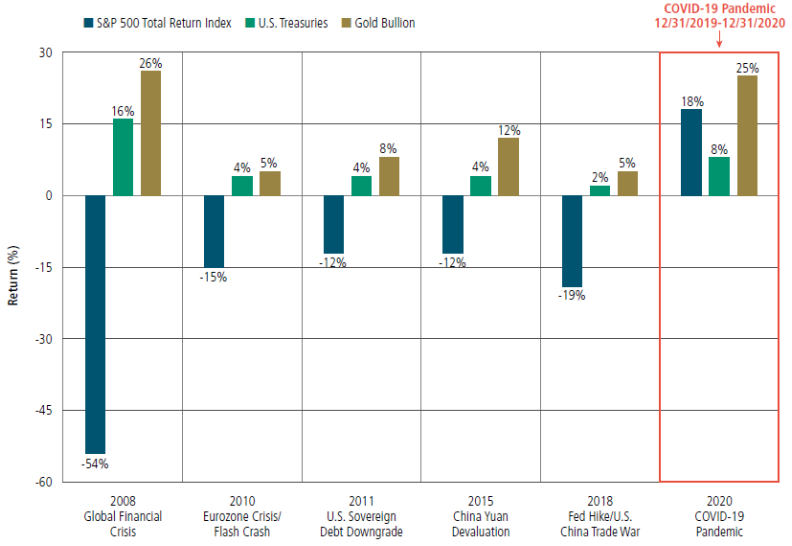
Source: Sprott Asset Management [Data as of 31/12/2020] [1]
With over 5,000 years of history and its track record as a source of security tried and tested in numerous major financial crises, there is no doubt that gold should have a place in every investors’ portfolio as protection and even investment. We have previously written a few articles to share why gold should be part of your portfolio:
Before we dive into why you should include gold in your portfolio, it is important to take a step back and understand the factors that drive gold prices.
What drives Gold Prices?
As mentioned earlier on, gold may be an important asset that every investor should have in their portfolio, but without a proper understanding of the “why” could do more harm than good to your portfolio in the long run. Investing in gold might be confusing and daunting for most due to the numerous and often contradicting factors influencing its price. Coupled with the financial jargons, most might not be skewed towards investing in gold.
In this section, I will introduce the four factors that drive gold prices to empower you when you conduct your own due diligence for gold.
1. “Real” Yield on Bonds
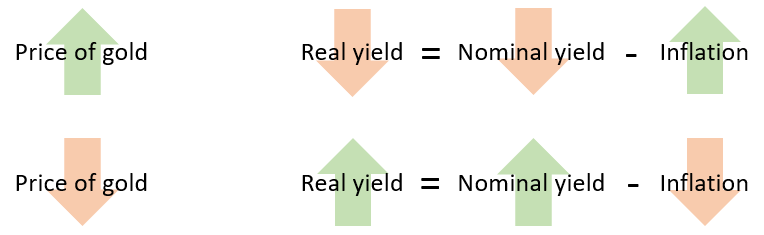
The real yield on bonds is simply the return an investor receives after taking into account the rate of inflation:
Real Yield = Nominal Yield – Inflation
For instance, if a bond yields 5% and inflation is running at 2%, the real yield for the bond is effectively 3%. Before explaining how real yield of bonds affects gold prices, let us first understand the 2 components that make up the real yield of a bond.
Nominal Yield
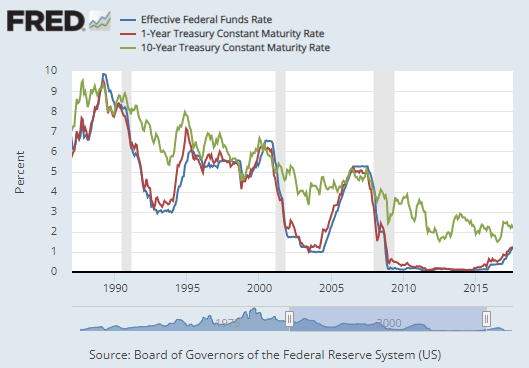
Nominal yield is the coupon rate of a bond and is essentially the interest rate that the bond issuer promises to pay the bond purchasers. Nominal yield of bonds, especially short-term bonds, closely tracks the federal funds rate which is the rate at which commercial banks borrow and lend their excess reserves to each other overnight. The Federal Open Market Committee (FOMC) holds meetings about once every six weeks (8 times annually) to discuss the state of the US economy and the future of monetary policies to set a target for the federal funds rate.
When the Federal Reserve reduces the federal funds rate, nominal yields of short-term bonds such as the US 1-year treasury bond tends to fall while for long-term bonds such as the US 10-year treasury bond, nominal yield tends to fall as well but to a lesser extent. The graph below illustrates how closely the short and long-term rates track the federal funds rate.
When nominal yield of these bonds falls, the opportunity cost (forgone benefit that would have been derived by an option not chosen) of forgoing interest-based assets such as bonds, is low hence making gold an attractive asset to own. In short, when the Federal Reserve reduces the federal funds rate target, gold becomes an attractive asset to own, driving up gold prices and vice versa.
One way to stay ahead of the market is to look out for key US economic data, such as job reports, wage data, manufacturing data and GDP growth, that influence the Federal Reserve’s monetary policy decisions. When these key economic data show strong economic growth, it implies that the Federal Reserve could be tightening its monetary policy (increasing federal funds rate), resulting in a higher opportunity cost for owning gold, pushing gold prices lower as a result. If you are already a POEMS user, you can easily look out for these economic data release dates in the POEMS 2.0 platform (under the “News & Research” tab, click on the “Economic Calendar” tab).
However, nominal yield takes inflation into account as well, hence it may not be a direct driver of gold prices. In fact, data from Sunshine Profits shows that there is no strong positive relationship between nominal yields of bonds and gold prices, as shown below.

Source: Sunshine Profits [3]
From the graph above, we see that when nominal yields were rising between the 1970s and 1980s, gold prices did not fall necessarily. Similarly, from the 1980s till date, as nominal yields fell, there was no significant upward trend in gold prices. As such, it is important to take inflation into account when looking at bond yields.
Inflation
Inflation is the rate of increase in prices of goods and services over a given period of time. During high levels of inflation, government-issued currencies (as well as bonds’ future payouts) are worth less while assets that are perceived as a store of value, such as gold, becomes more attractive to own, thus driving up gold prices. In short, when inflation rises or when investors expect inflation rates to increase, gold prices tend to go up. However, just like nominal bond yields, the relationship between inflation and gold prices is not always constant.
In conclusion, gold prices are largely influenced by the real yield of bonds which takes into account both nominal yields of bonds and inflation. Data from the US Treasury shows that there is a strong inverse correlation between the real yield of bonds, derived from the 10-year Treasury Inflation Protected Security (TIPS) (TIPS rate = Treasury rate – inflation expectations), and gold price as shown below.

Source: goldBroker [4]
Note that the 10-year TIPS rate on the left axis in the chart above is inverted. We can hence conclude that the inverted TIPS rate correlates strongly with gold prices.
To sum up, when nominal yields decrease, inflation increases, real yields of bonds go down. When real yields decrease, gold prices tend to go up and vice versa. The illustration below sums up the relationship between real yield of bonds and gold prices.
Source: POEMS
2. Value of the US Dollar
The second factor that influences the price of gold is the value of the US dollar. Like most internationally traded commodities, the price of gold is quoted in dollars. When the dollar weakens against other currencies, gold becomes cheaper to buy overseas, increasing international demand and pushing gold prices up. The rise in prices was further pushed by American investors seeking out stores of value, adding to the increased demand for gold. In short, when the US dollar weakens, gold prices tend to go up.
However, this inverse relationship between the value of the US dollar and gold prices may not always hold true as there can be periods where both the dollar and gold strengthen simultaneously. This is because the US dollar, along with the Japanese yen and Swiss franc, is considered a “safe-haven” investment during times of market turbulence. Since gold is also considered as a “safe haven” asset, global uncertainty can cause a “flight to safety” situation, in which both the US dollar and price of gold rise in tandem.
3. Periods of Economic and/or Geopolitical Volatility
The perception of gold as a safe-haven asset brings us to the third factor that influences the price of gold: economic and/or geopolitical volatility. Gold is a physical commodity with limited supply. Its value cannot be diluted by inflation, interest rate decisions by a government or fresh currency creation, making it a safe haven asset for investors to count on during times of market turbulence.
However, unlike the formerly mentioned factors, there is no specific quantitative measure we can look at to ascertain the uncertainty that affects gold prices. Uncertainty is a psychological factor that depends on the overall investor sentiment. Some examples of events that can contribute to global uncertainty such as the outcome of Brexit for the UK, the result of the 46th US Presidential Elections or the most recent China Evergrande’s debt crisis. These uncertainties could push the demand for gold higher, driving prices up further.
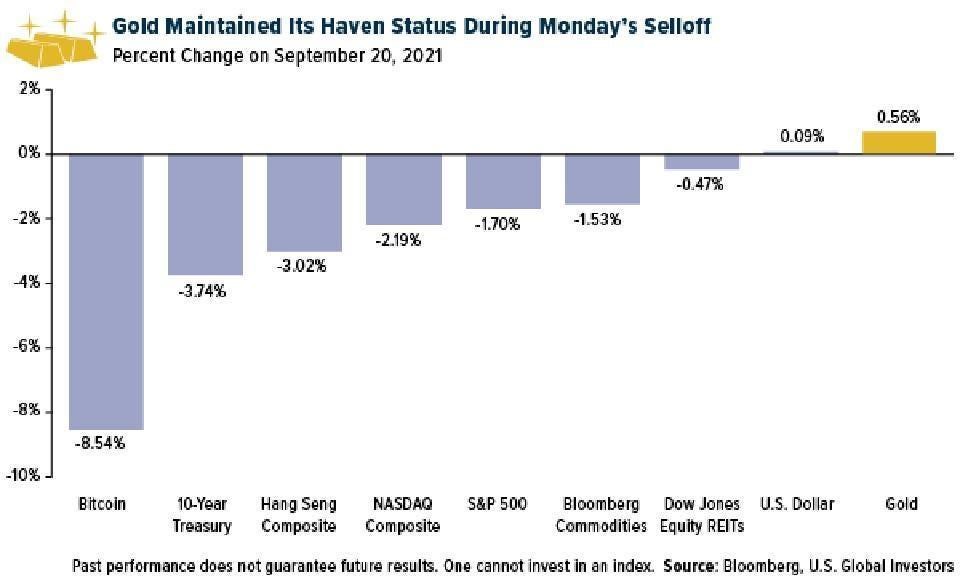
The recent China Evergrande saga resulted in rising uncertainties for investors who caused the Evergrande sell-off spreading to the US market, as well as to riskier assets such as Bitcoin, which plunged by 8.5% on 20 September 2021 as illustrated below. Gold on the other hand, was the only asset class that saw a positive percent change of about 0.56% on the same day. Other asset classes saw negative percentage changes, reinforcing gold’s safe haven status.
Source: Forbes [5]
4. Supply and Demand
The last factor that influences the price of gold: supply and demand, a point which I feel may be often overlooked by investors when analysing gold prices. An increase in demand for gold coupled with a constraint or low supply typically translates to a surge in the yellow metal’s price. In this section I will discuss the demand and supply factors individually, and how gold prices correlate to each of them.
Demand
Gold is a highly coveted commodity with many real-life uses, particularly in the jewelry and technology sectors. Demand for gold also comes from central banks and investment vehicles such as Exchange Traded Funds (ETFs) that specialise in gold and its currency. However, not all of these factors are direct drivers of gold prices, rather it could be the other way round, where gold prices drive the demand for those factors. The graph below illustrates how the aggregate demand for the jewelry and technology sectors, investment and central banks over the years affects gold prices.

Source: goldhub [6]
From the graph above, you may have noticed that there seems to be no strong correlation between the aggregate demand for gold and the price of gold. This is because not all of these four factors share the same relationship with gold prices. As such, we would have to analyse each of these factors individually to better understand their relationship with gold prices.
- Gold Jewelry Demand
Referring to the same graph above, you would have noticed that jewelry accounts for the bulk of the demand for gold over the past decade. China, India and the US are the largest consumers of gold for jewelry, accounting for 413.8, 315.9 and 180.9 tonnes of gold in 2020 respectively [8]. Most investors would assume that demand for jewelry would drive gold prices up, however that is not always the case. It is actually gold prices that drive demand for jewelry. When the price of gold rises, consumers tend to buy less gold jewelry (lower demand) and vice versa. From the graph below, we can see that between the 1990s and 2000s, the rising gold prices coincided with the declining jewelry demand.

Source: Sunshine Profits [7]
While this highlights the limited influence of jewelry demand on the price action of gold, this does not equate to the demand for gold jewelry. As seen from the aggregate demand of gold from the graph earlier, jewelry forms a huge bulk of the overall demand for gold. As of 2020, it contributes to about 37.5% of the aggregate demand for gold. This is important to investors as it can serve to support the gold prices during periods where macro factors begin to shift against gold’s favour. For instance, in 2013, heavy investor selling triggered a 30% collapse in gold prices which in turn led to a surge in jewelry demand that ultimately allowed prices to stabilise and form a floor. The graph below illustrates how the surge in jewelry demand managed to stabilise gold prices in 2013.
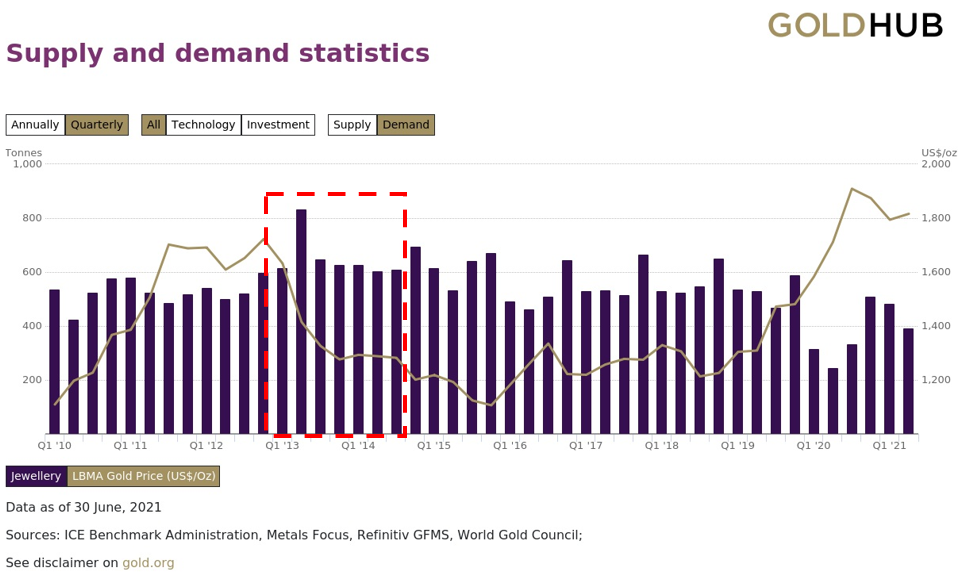
Source: goldhub [6]
- Gold Technology Demand
Apart from jewelry, gold has many technological and industrial uses such as in electronics, medicine, dentistry and aerospace. The below diagram briefly explains the various use of gold in these 4 areas.

Similar to gold jewelry demand, technology demand for gold is not exactly a price driver but rather, it is the gold prices that drive the demand of gold from these technology and industrial firms. As a non-consumable good, nearly all the gold mined in history still exists in some form. Gold is not used extensively in electronic equipment (The use of gold in technology only accounts for only 8% of the aggregate demand in 2020), and firms are not interested in gold speculation. Therefore, these firms are price-takers, not price-setters.
- Central Banks’ Demand for gold
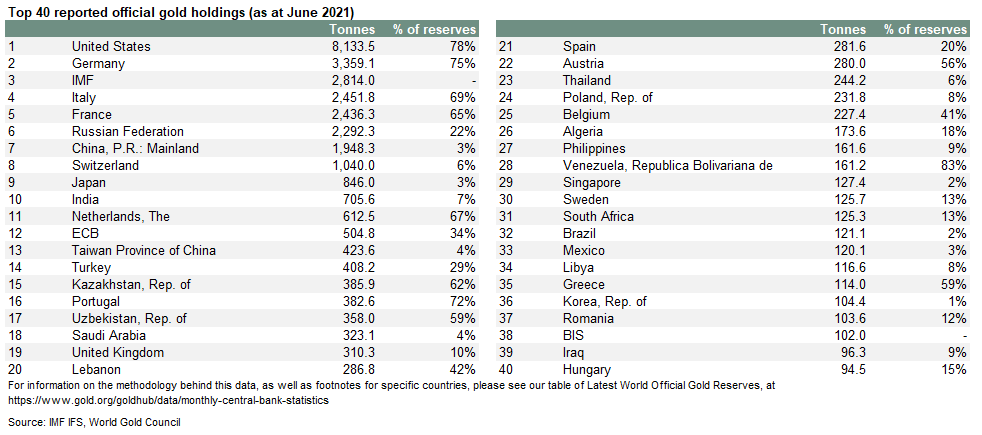
One of gold’s primary roles for central banks is to diversify their reserves and provide a hedge against inflation. According to the 2020 Central Bank gold Reserves Survey, central banks have cited gold’s performance during crises as one of the top reasons why they hold onto their gold reserves. However, it is important to note that the profile of the most active central banks has changed, with the traditional economic powerhouses such as the US, Germany, France and Italy no longer buying more gold but instead retaining the substantial holdings they already have. On the other hand, emerging economies such as Russia, China, Turkey and India are replacing their places as the few major purchasers of gold. The below chart shows the top 40 official gold reserves based on volume as of June 2021.
Source: goldhub [8]
Referring back to the graph that shows the aggregate demand of gold across the four categories, demand from the central banks is actually the lowest as of 2020, which accounts for about 255 tonnes of gold [8].
Next, let’s analyse how the central banks’ demand for gold correlates with gold prices.

Source: Sunshine Profits [7]
Based on the basic supply and demand theory, we would expect gold prices to rise correspondingly when the demand from the central bank rises. However, if you were to look at the chart above, gold prices were rising after 2001 despite the fact that central banks were heavy sellers of gold between 2001 and 2009. In 2014, when the demand from the central banks increased, gold prices fell. As such, the demand from central banks alone would not be sufficient to gauge the price action of gold and therefore safe to conclude that the demand from central banks is not exactly a price driver for gold but rather it can put a floor under the price of gold or strengthen the existing market sentiment.
- Gold Investment Demand
The gold investment demand is made up of direct ownership of physical gold such as gold bars and coins, as well as indirect ownership via ETFs that specialise in gold and gold currency. Out of the four categories of gold demand, gold investment demand is probably the most important category that really drives gold prices. Earlier, we compared the aggregate demand of gold across the 4 categories with the price movement of gold for the past decade earlier on and could not find a strong relationship between the two? Well, if we were to just look at the gold investment demand alongside with the price movement of gold over the past decade, we might finally be able to explain the main demand factor that drives gold prices.

Source: goldhub [6]
As you can see from the graph above, there is a clear relationship between gold investment demand and gold prices over the past decade; when gold investment demand rises, gold prices rise correspondingly. One of the main reasons for this relationship is due to the sheer volume of demand coming from gold investments such as gold bullions and gold ETFs; in 2020, gold investment demand accounted for approximately 47.5% of the total demand across the 4 categories [8].
You might be thinking, since the total demand for jewelry and technology more or less matches that of investments, why don’t they have the same relationship with gold prices? That is due to the motivation behind the demand for investment purposes. Unlike the demand for jewelry and technology, gold investment demand is heavily dependent on the macroeconomic factors that we have discussed earlier; investors purchase or sell gold for reasons such as speculation, wealth preservation and hedging according to the macroeconomic conditions.
As such, while these fundamental demand factors are important, I think that the three macroeconomic factors detailed earlier are likely to play a bigger role in determining gold prices in the current environment. It is also important to note by now that the relationship between the demand factors and gold prices is not always so straightforward. In the gold demand from jewelry and technology, it is the gold prices that influence the demand, not the other way round.
Supply
The supply of gold has not changed significantly over the past decade as seen from the chart below. Each year, about 4,000 to 5,000 tonnes of gold are added to the overall stock of gold.
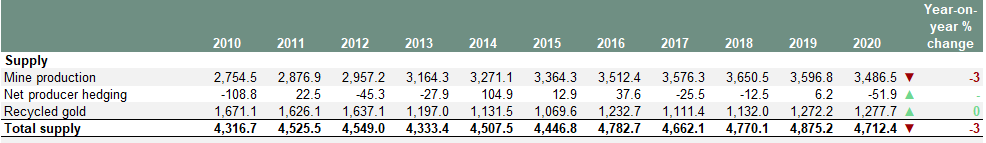
Source: goldhub [8]
The supply of gold comes mainly from gold mining as well as recycled gold. Mine production is the largest source, accounting for 75% of annual gold supply. However, mine production is starting to reach a plateau over the past few years; in fact, in 2019 and 2020, the volume from gold production has shown a negative year-on-year change. 2019 saw the first annual decline in production since 2008. Presently, it is estimated that there is only about 20% of gold left to be mined. With existing reserves gradually being exhausted, it is said that we might have reached, as experts say – peak gold, when we have mined the most we ever can in any one year and the growth in mine supply may slow or decline slightly in the coming years.

Source: goldhub [6]
Nonetheless, with new technologies, such as big data, AI and smart data mining, miners may be able to extract gold at sites which were originally overlooked.
On top of that, unlike other non-renewable resources like oil, gold can be recycled, which has been another important source of gold supply over the years to meet the demand. The majority of recycled gold, around 90%, comes from jewelry, with gold extracted from technological products, such as mobile phones, providing the remaining 10% [9]. Supply of gold from recycling has been hovering between 1,000 and 1,300 tonnes. Adding this to the supply from mining production, it barely meets the annual demand for gold.
With the tight supply of gold barely meeting demands, coupled with the possibility of already reaching peak gold, we may gradually see demand exceeding supply over the next decade. In the event where demand exceeds supply, we may see this as a possible driver to push up gold prices further. That being said, with up and coming technology to extract gold more economically as well as the option for recycling, the shortage of gold may not be a pressing concern that will dramatically affect gold prices in the near term.
Till this point of the article, you would have a good grasp of what drives the gold price, be it macroeconomic factors or fundamental factors such as the supply and demand. After understanding the “why” behind the inclusion of gold in your portfolio, it is time to move on to the last section where we discussed the different forms of gold investments that you can gain exposure to.
How to gain exposure to Gold?
In the market, there are lots of different types of investment instruments that you can gain exposure to gold, ranging from simple instruments such as gold mining stocks and gold ETFs to more complex instruments such as commodity-linked structured products. However, to save you from the confusion and to maintain the relevance of this article to the majority of the readers here, I will be discussing a few mainstream investment instruments that retail investors can easily invest in to gain exposure to the gold market. The different ways to invest in gold that I will be discussing is as follows:
- Gold ETFs
- Gold CFDs
Gold ETFs are convenient and cost-efficient investment vehicles for investors to gain exposure to gold without having to pay for the logistic and insurance costs of holding physical gold. With gold ETFs, investors can now easily buy and sell shares of the ETFs on exchanges and take advantage of the strategic and tactical properties of gold as a unique asset class for their investment portfolio.
There are many great gold ETFs in the market to choose from, but I have chosen 3 gold ETFs that I believe are able to cater to a wider range of investors based on the method the fund gains exposure to the gold market (whether it uses borrowed money or financial derivatives), its assets under management (AUM) (generally higher liquidity, lower expense ratio and less likely to be manipulated) and of course, its expense ratio (higher expense ratio would result in lower returns for investors). The three ETFs are as follows:
- SPDR gold Shares (Ticker: GLD): The go-to fund for investors looking to gain exposure into the gold market without being exposed to high risk as the fund is benchmarked to the gold bullion. Launched in 2004, the fund has a rather long history and track record. It also has a relatively low expense ratio of 0.4%, meaning for every $10,000 invested, the expense ratio would be $40. Lastly, it has a huge AUM of about USD 57.05 billion as of 23 September 2021.
- SPDR gold MiniShares (Ticker: GLDM): For investors who still feel that the expense ratio of 0.40% charged by GLD is still a bit steep, you can consider looking at GLDM, a fund launched in 2018 with an expense ratio of just 0.18% to match other gold ETFs that has a lower expense ratio than the GLD. The reason for the introducing GLDM rather than reducing GLD’s expense ratio is because GLD is a favourite among professional traders and institutional investors, hence the GLDM was introduced to better match other competitive gold ETFs to better cater to retail investors. Similar to the GLD, the GLDM is designed to reflect the price performance of gold bullion. The only downside would be its short history and track record as well as a lower AUM as compared to the GLD.
- iShares gold Trust (Ticker: IAU): Much similar to the GLD, it reflects the price performance of the gold bullion and it actually mirrors closely to the GLD fund. The differences between the IAU and GLD fund is that IAU is slightly younger (launched in 2005), has a lower AUM of about USD 28.43 billion and a lower expense ratio of 0.25%. Generally, I would say the IAU is somewhere in between the GLD and GLDM in terms of history, AUM and expense ratio.
The table below summarises the details of the three funds discussed.
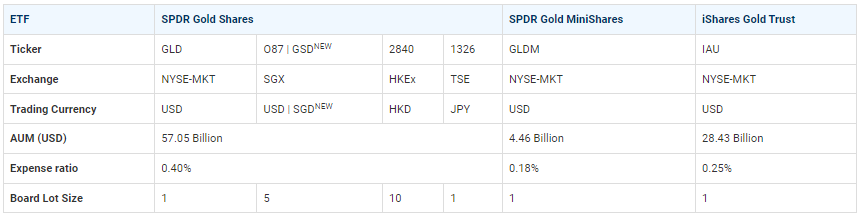
Source: POEMS (Information accurate as of 23 September 2021)
Another way for investors to gain exposure to the price movement of the yellow metal is through gold CFDs. Before sharing what are the different gold CFDs available for you to look at, let’s understand what CFDs are first. CFD stands for contracts for differences, and it is a contract between the investor and the CFD broker to exchange the difference in the value of a financial product between the time the contract opens and closes. CFDs allow investors to profit from the price movement without owning the underlying assets, in a sense similar to that of ETFs. We offer various forms of CFDs, including equities, forex, commodities and world indices CFDs.
Gold CFDs are commodities CFD that we offer on our POEMS platform and the features are as follows:
- Leverage: As commodities CFD is a leveraged product traded on margin (20% margin requirements), investors only pay a fraction of the contract value to gain exposure to the underlying commodity contract. However, do note that leverage is a double-edged sword, it can magnify both your gains and losses.
- Long and short: Our commodities CFD allows investors to have the flexibility to take long and short positions. Thus, unlike ETFs, CFD allows investors to benefit in both the bull and bear market. This also allows investors to use CFDs as a hedging tool to protect your long-term positions from short-term volatility. For instance, you currently have a long position in SPDR gold Shares ETF. However, due to market conditions, you expect your ETF position to drop in the near future. In this case, you can then hedge your position by shorting SPDR gold Shares ETF using a CFD.
- No Storage Cost: Commodities CFD is a derivative; investors do not actually own the commodity. They can gain exposure to price changes in the underlying commodity and avoid the risks and costs involved in owning physical commodities at the same time.
For gold CFDs, we offer two types of CFD, namely gold USD1 CFD and gold USD100 CFD. As the name suggests, the former allows investors with a smaller capital outlay to open a smaller contract size while the latter allows investors to open a much larger contract size.
The table below summarises the details about the two gold CFDs discussed.
| Product | Value of 1 Index Point | Contract Size | Margin Requirements | Order Submission Range | Market Trading Hours | Settlement Currency | Dividend Adjustment |
|---|---|---|---|---|---|---|---|
| Gold USD1 CFD | US$1 | US$1 x Gold USD1 CFD Price x Quantity | 20% | +/- 5% from bid/ask price | 07:01 – 04:00 (DS) 07:01 – 05:00 (NDS) |
US Dollars | No |
| Gold USD100 CFD | US$100 | US$100 x Gold USD100 CFD Price x Quantity |
Source: POEMS
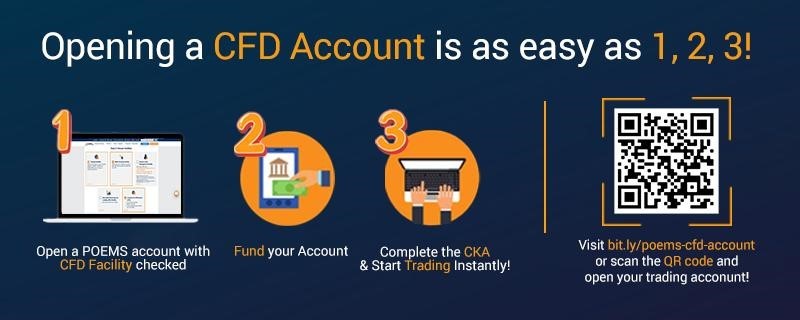
*Do note that to trade CFDs, you would require a POEMS account with CFD Facility enabled, you may refer to the last section of this article (“How to get started”) to find out more.
Conclusion
To wrap up, I hope this article has allowed you to gain a deeper understanding of the various factors that drive gold prices and the next time when you read reports or articles about gold, you would finally be able to connect the dots so as to make informed decisions before investing in the gold market. If you are interested in trading gold ETFs or gold CFDs but have yet to open an account with us, refer to the last section below to kickstart your investment journey with us!
How to get Started
Looking for ways to trade gold? You can now trade with POEMS!
1) Trade Gold ETFs from US$1.88 flat
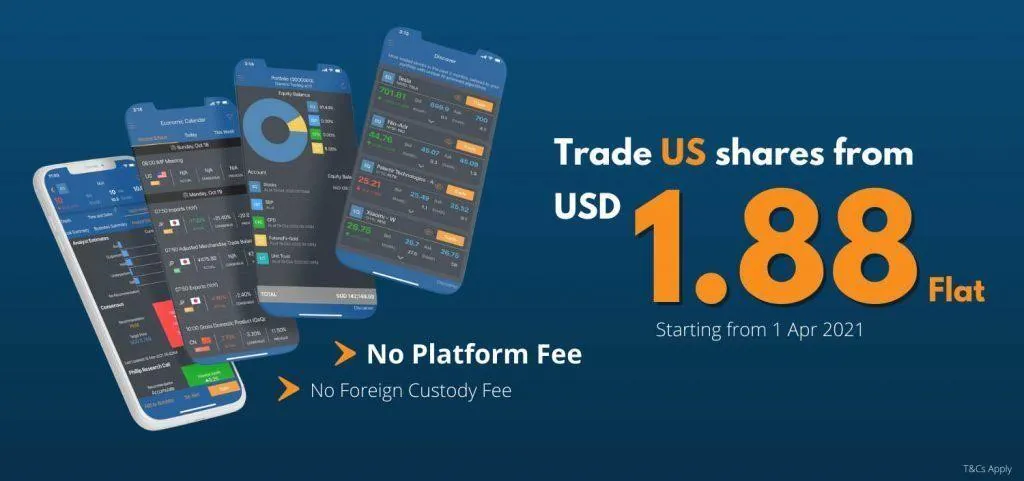
Explore an array of US shares at brokerage fees as low as US$1.88 flat* when you open a Cash Plus Account with us today. Find out more here. T&Cs apply.
2) Trade gold CFDs like gold USD1 CFD and gold USD100 CFD, with or without leverage, and enjoy exclusive welcome gifts for new CFD traders

From 1 July 2021 to 31 December 2021, fund your CFD account and start trading to enjoy FREE* CFD Contracts such as NIO, Tesla & more (Funding Reward + Trading Reward). Eligible CFD products for the promotion include Commodities CFD such as gold CFDs, Indices CFD and Equities CFD. Find out more here. T&Cs apply.
Investors and traders with a bigger risk appetite may consider using Contracts for Differences (CFDs) to invest in the gold market. CFDs are versatile tools for investors, particularly those who take an active approach to investing. CFDs can be used for hedging, short-selling and even leveraged trading. They only require minimum investments upfront, which are known as the margin requirement and are also ideal tools for people with less capital but who wish to capitalise on the growth potential of certain industries. Or they may simply want to take advantage of the latest market movements regardless of direction.
CFDs, however, may not be suitable for investors whose investment objective is to preserve capital and/or whose risk tolerance is low.
To understand more about CFDs, read our article on “Understanding Contracts for Differences”.
We sincerely hope that you found value reading this article! If you do not have a POEMS account, you may visit this link or scan the QR code below to open one with us today!
Open a POEMS account within minutes and trade instantly!
For enquiries, please email us at cfd@phillip.com.sg. If you are interested in active discussions, you can also join our Telegram community here.
More Articles
The Ultimate Guide to Trading and Investing in Stocks Listed in HKEX

Fun fact: Did you know? The Hong Kong Stock Exchange finished 2020 as the second-biggest IPO market globally! Read our latest article to find out more!
Can Value Still Be Found in Alibaba Group Holding?

Can Value still be found in Alibaba Group Holding? Read our article to find out more!
Hang Seng Index's Biggest Revamp in 51-Year- History: Winners & Losers

Who are the potential winners and losers for the revamp of the Hang Seng Index? Read on our article to find out more!
Disclaimer
This material is provided to you for general information only and does not constitute a recommendation, an offer or solicitation to buy or sell the investment product mentioned. It does not have any regard to your specific investment objectives, financial situation or any of your particular needs. Accordingly, no warranty whatsoever is given and not liability whatsoever is accepted for any loss arising whether directly or indirectly as a result of your acting based on this information.
Investments are subject to investment risks. The risk of loss in leveraged trading can be substantial. You may sustain losses in excess of your initial funds and may be called upon to deposit additional margin funds at short notice. If the required funds are not provided within the prescribed time, your positions may be liquidated. The resulting deficits in your account are subject to penalty charges. The value of investments denominated in foreign currencies may diminish or increase due to changes in the rates of exchange. You should also be aware of the commissions and finance costs involved in trading leveraged products. This product may not be suitable for clients whose investment objective is preservation of capital and/or whose risk tolerance is low. Clients are advised to understand the nature and risks involved in margin trading.
You may wish to obtain advice from a qualified financial adviser, pursuant to a separate engagement, before making a commitment to purchase any of the investment products mentioned herein. In the event that you choose not to obtain advice from a qualified financial adviser, you should assess and consider whether the investment product is suitable for you before proceeding to invest and we do not offer any advice in this regard unless mandated to do so by way of a separate engagement. You are advised to read the trading account Terms & Conditions and Risk Disclosure Statement (available online at www.poems.com.sg) before trading in this product.
Any CFD offered is not approved or endorsed by the issuer or originator of the underlying securities and the issuer or originator is not privy to the CFD contract. This advertisement has not been reviewed by the Monetary Authority of Singapore (MAS).
